Every Trump-Endorsed Crypto is Down 60%. Will Hyperliquid be Different?
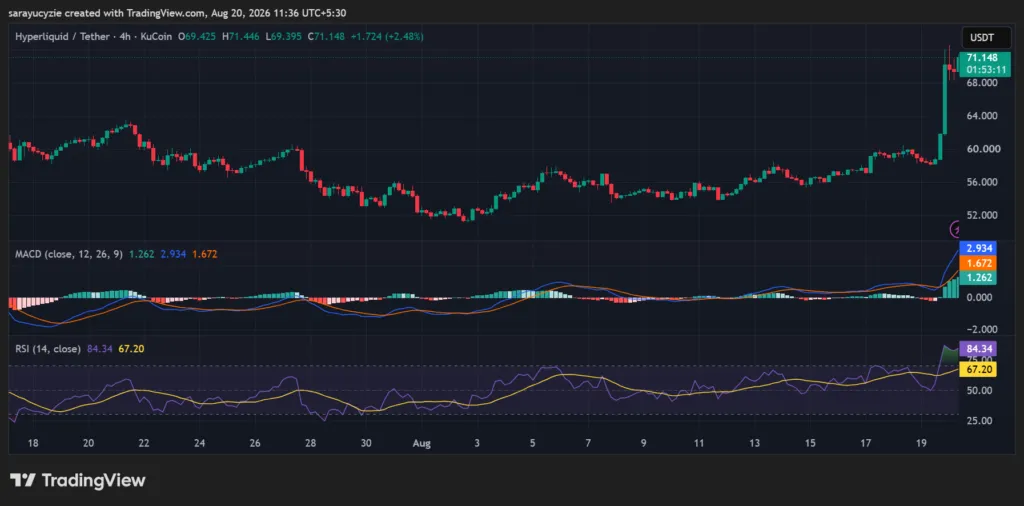
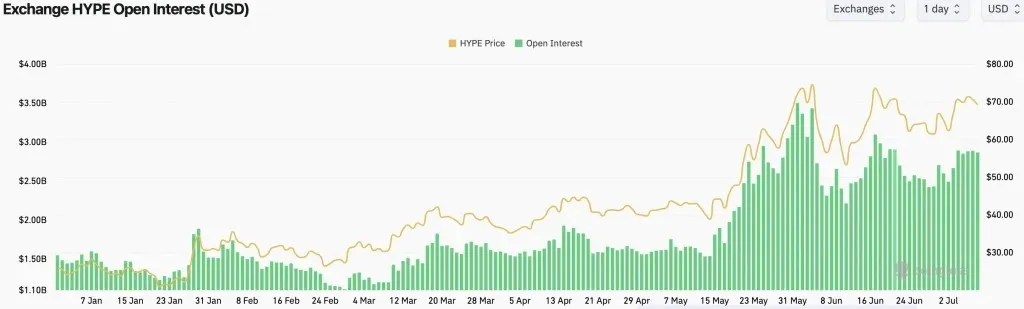
President Donald Trump has made eight crypto endorsements since taking office. Every one trades below its pre-endorsement price, down 60% on average. On Wednesday, he made his ninth by naming Hyperliquid (HYPE) at the White House. The token jumped 14% within two hours. Whether HYPE escapes the Trump-endorsed crypto pattern depends on something no earlier pick had. A regulator is actually working on the promise. What Trump Actually Promised Hyperliquid Trump name-dropped Hyperliquid on Wednesday while hosting executives from Coinbase, Ripple, Nasdaq, and other firms at the White House. Sponsored Sponsored “I understand that Mike is also working to bring Hyperliquid into the United States in a fully compliant and legal fashion,” Donald Trump, remarks at the White House, August 19, 2026. “Mike” is Michael Selig, chairman of the Commodity Futures Trading Commission (CFTC), the agency that oversees US derivatives markets. Minutes after the comment, HYPE spiked from $62.23 to nearly $71. Hyperliquid Strategies, a Nasdaq-listed company that holds HYPE in its treasury, closed 30% higher on its best day on record. HYPE trades near $71.45 at press time, up 21.3% over 24 hours. The token now ranks tenth by market cap at $15.9 billion. Hyperliquid (HYPE) Price Performance. Source: BeInCrypto Notably, Trump had never mentioned Hyperliquid before, in any post