






Bitcoin maintains solid upward momentum, with the price zone above $30,000 being sustained for over two weeks.
Despite a drop below $31,000 after the release of the FOMC meeting minutes, demand for Bitcoin futures from institutional and professional investors remains strong.
BTCs price is looking to break the $31,200 resistance level, with a potential target of $35,500 on the weekly chart.
Bitcoin (BTC) is creating a solid upward momentum when the $30,000 price zone has been maintained for more than 2 weeks.
Earlier, the Bitcoin price saw a substantial increase in selling pressure in the wake of the minutes of the United States Federal Open Market Committee (FOMC) meeting in June.
While BTC has dropped below the $31,000 mark, the growth in demand for Bitcoin futures from institutional and professional investors remains, implying a price squeeze for the flagship decentralized finance (DeFi) commodity is possible.
The second Bitcoin halving will take place in May 2024. A bull run is possible if the qualities identified during prior halving occurrences are maintained.
The largest cryptocurrency is up 1.4% to $31,200 on Friday, while the second-largest crypto, Ethereum, has, in the last 24 hours, increased 0.75% to trade at $1,945. This can be said to be a step to create momentum for the upcoming rally of the coins with the largest market capitalization.
Bitcoin price is securely above the immediate support level of $30,500, with a much stronger support level of $30,000 predicted. BTC soared in June, regaining resistance above $31,000, boosted by various filings by businesses seeking to launch a spot Bitcoin ETF.
Looking at the daily chart, BTCs price is looking to break its $31,200 resistance and move towards a further area. This is evident in the candlesticks retreating and trading higher each day.
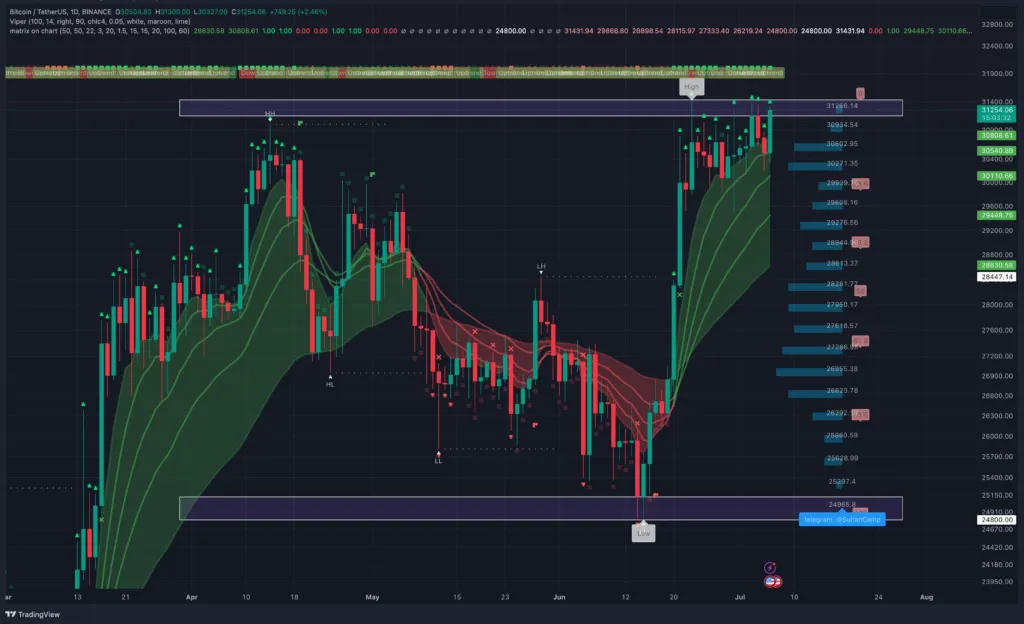
BTC 1D price chart. Source: TradingView
More broadly, on the weekly chart, the price area where BTC could place its outlook is at $35,500, which is also its Fib %38.2 level since the drop early last year.
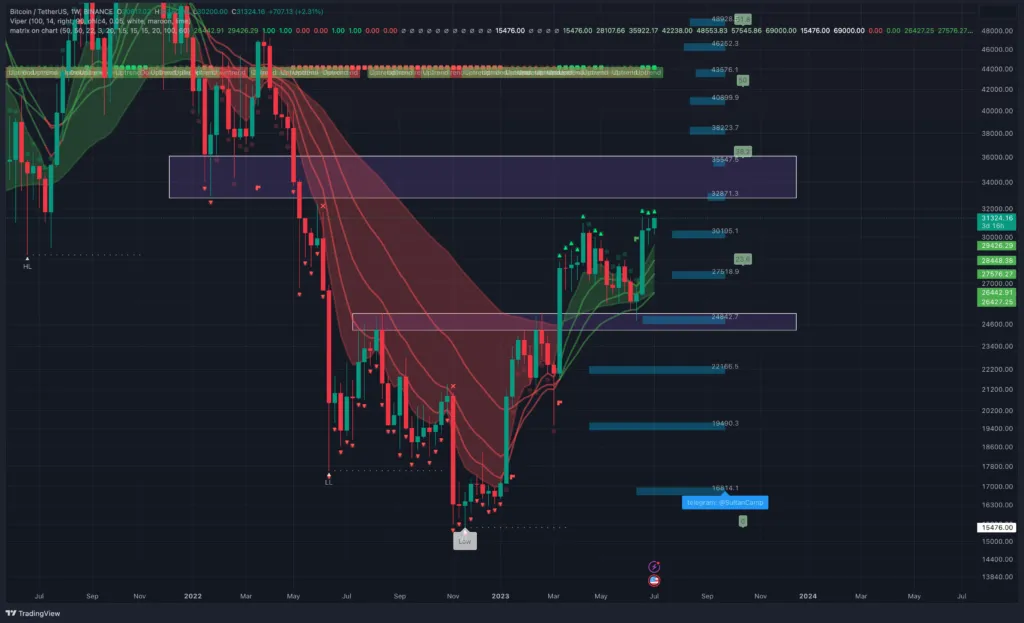
BTC 1W price chart. Source: TradingView
The time is now quite favorable for investors to consider as the BTC price zone breaks above $32,000 and retracements in the near term. Waiting will limit the risk and it is safer to buy at the current resistance level.