




Two price levels stand out for Cardano as possible bottom areas, as its price persistently drops below key supports to lower levels.
At press time, Cardano ($ADA) trades for $0.148, down 5% this week. Notably, the cryptocurrency has been under sustained pressure since the broader market decline began late last year.
Since Bitcoin peaked at $126,200 in October 2025, it has dragged altcoins downward with it. Notably, Cardano has been one of the worst-performing large-cap cryptos in the ongoing corrective phase, dropping 85% from its August 2025 high of $1.02.
Meanwhile, the current price action suggests the search for a definitive bottom continues to elude Cardano. With bears still in control, chart analysis has highlighted two major price zones to watch for a possible price floor.
Cardano Falls Below Another Support
On the 4-hour chart, $ADA has broken another support level. On Wednesday, it dropped below the $1.48 lower timeframe support as the broader crypto market reacted to Strategys MSTR stock dropping below $100.
Cardano dipped to a low of $0.139 before bulls stepped in. Currently, the asset is retesting this support. A daily close below it could confirm the breakdown, which holds bearish implications for the coin.
Notably, this is the second support that $ADA is breaching in a few days. On June 23, the altcoin broke below the $0.159-$0.164 support zone, a level that had previously acted as a short-term floor. Cardano entered this range on June 18 and has since consolidated within it before breaking below on Tuesday.
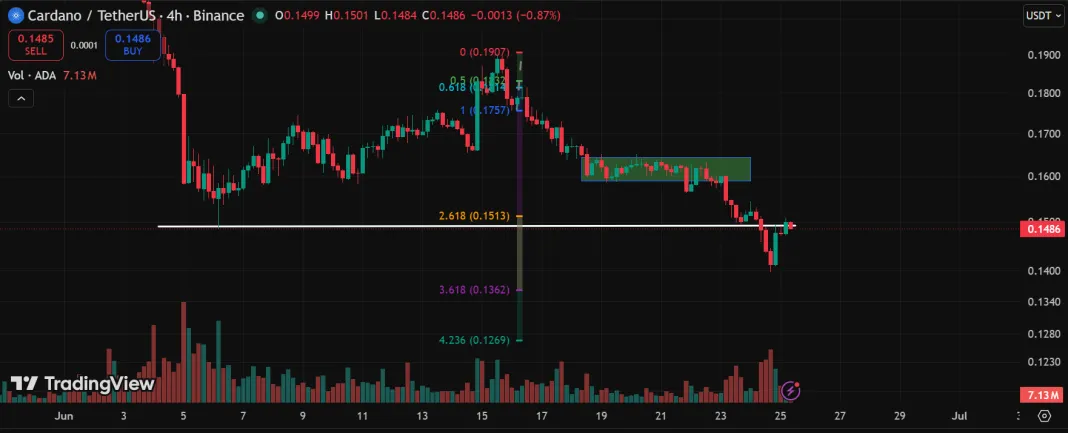
Cardano 4H Chart
The persistent support breakdown keeps the prevailing bearish structure intact. When prices continue to break below support areas, it suggests weakness. Further, it opens the door to deeper retracements.
Potential Cardano Bottom Zones
Nonetheless, Cardano has already depleted substantially from prior highs. As such, analysts are closely monitoring where the price could possibly find a durable bottom despite signals that bears are still on top. Based on the current Fibonacci extension structure, two support areas are now attracting attention.
The first sits near $0.136, aligning with the 3.618 Fibonacci extension level. If selling pressure continues, this could become the next area where buyers attempt to slow the decline and form a base. Cardano would have to fall 8.7% to reach this level
Below that, the second major level comes in around $0.127, corresponding with the 4.236 Fibonacci extension. This marks a deeper support zone and would take $ADA to the December 2020 lows, where prices rebounded sharply.
Notably, while these levels provide potential areas, there is no confirmation that Cardano would reach its floor there. A separate analysis places the target at $0.10, and another suggests the bottom would happen this month, highlighting the uncertainty due to unstable market conditions.
In the meantime, the trend remains lower, as Cardano has not shown a convincing reversal signal.