




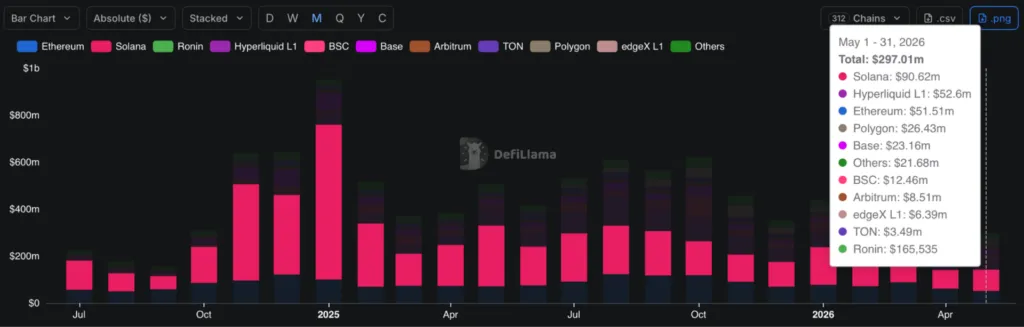
Solana ended the month of May at the number one position in the app revenue table across every chain at $90.62 million according to data from DefiLlama. Despite this bullish read, $SOL finished the same month with the eighth consecutive red monthly candle, the longest losing streak in the tokens history. The network kept printing money while the asset kept printing lower lows.
The losing streak started in October last year, when $SOL was trading at around $220. Fast forward to May and the token closed the month near $82. That is roughly $78 billion in market cap gone, leaving the token around $47 billion.
Why App Revenue Reads Cleaner Than TVL
App revenue is the money applications actually keep from users. It is not transaction counts, which have the potential to be inflated by bots, and not total value locked, which can swing with token prices. It is real fees paid to use products on the chain, which makes it the closest thing crypto has to a product market fit read. Solana apps pulled in more than any other network in May, extending a lead the chain has held for most of the past year.
Most of the app revenue on the network currently comes from trading and token launches. Pump.fun alone was responsible for around 42% of Solana app revenue through the first quarter of this year. The part that matters for the token price comes from the fact that the revenue flows to the app teams, not to $SOL holders. Usage proves people want the products. It was never proof they want $SOL, and the eight red candles are what that gap looks like on a chart.
The One Green Column: ETF Flows
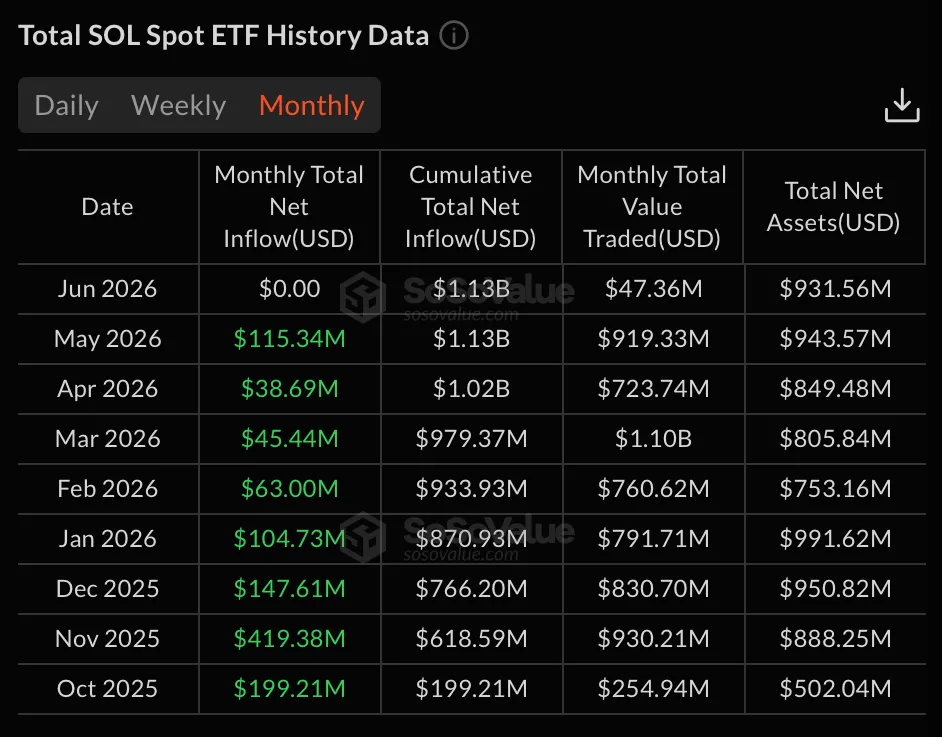
Despite a weak month for the asset class, Solana spot ETF flows show that institutional demand remained steady. Data from SoSoValue highlighted that Solana spot ETFs ended the month of May with $115.34 million in cumulative inflows without registering a single day of outflows throughout the month. This took place even as Bitcoin ETFs saw negative flows in May of -$2.43 billion, its worst month since November, and Ethereum ETFs seeing -$540.88 million in outflows. The positive month for $SOL ETFs in May now means that positive monthly flows every month since launching in October last year remains intact.
A Bear Tape, Not a Solana Failure
The streak looks worse alone than it does in context. Bitcoin sealed its third red month of 2026 and opened June below $72K, Ethereum slipped under $2,000, and the total crypto market cap sat near $2.46 trillion. Messari described Q1 as the market entering a bear phase outright. $SOLs eight-month slide is the sharpest version of a tape that has gone against nearly every major asset.
What Decides June
The bull catalysts are stacked. The Alpenglow upgrade targets finality near 150ms, ETF demand keeps showing up, and RWA value on Solana grew 43% in Q1 to about $2 billion. The risks are just as real. Leverage is still unwinding, the trading-driven revenue could thin out if the launchpad cycle cools, and the competition is heating up, with Hyperliquid now out-earning every chain on fee revenue in 2026.
June opened with $SOL near $80 and a fresh monthly candle. Hold that floor and the streak ends at eight. Lose it, and nine comes into view.