




XRP has shown heightened instability, and a recent price analysis has attempted to provide context for its future price trajectory.
The uncertainty around the next price direction for XRP has left several enthusiasts wary. With questions of “what comes next” increasingly making the rounds, crypto YouTuber Blockchain Backer has given his thoughts.
“Its Really Not That Easy”
In his December 18 post, he emphasized that predicting what comes next for XRP is not easy. Notably, he called the current market trend a “goblin town situation,” a term used to describe a persistently declining market.
Notably, XRP trades at $1.86, up nearly 1.5% in the past 24 hours. While it has shown strength in this timeframe, it has retraced by 13.7% in the previous 30 days. Additionally, the coin has corrected a staggering 49% from its July high of $3.66.
However, the analyst highlighted that market conditions like these are normal. According to him, they come before the next decisive market move. Hence, he concluded that “chop is common.”
XRP Exhibit 2022 Similarities with Cardano
Meanwhile, Blockchain Backer shared a chart that could provide context for XRP‘s next price trajectory. Interestingly, it shows a close correlation between how Cardano trended in 2022 and XRP’s current price action.
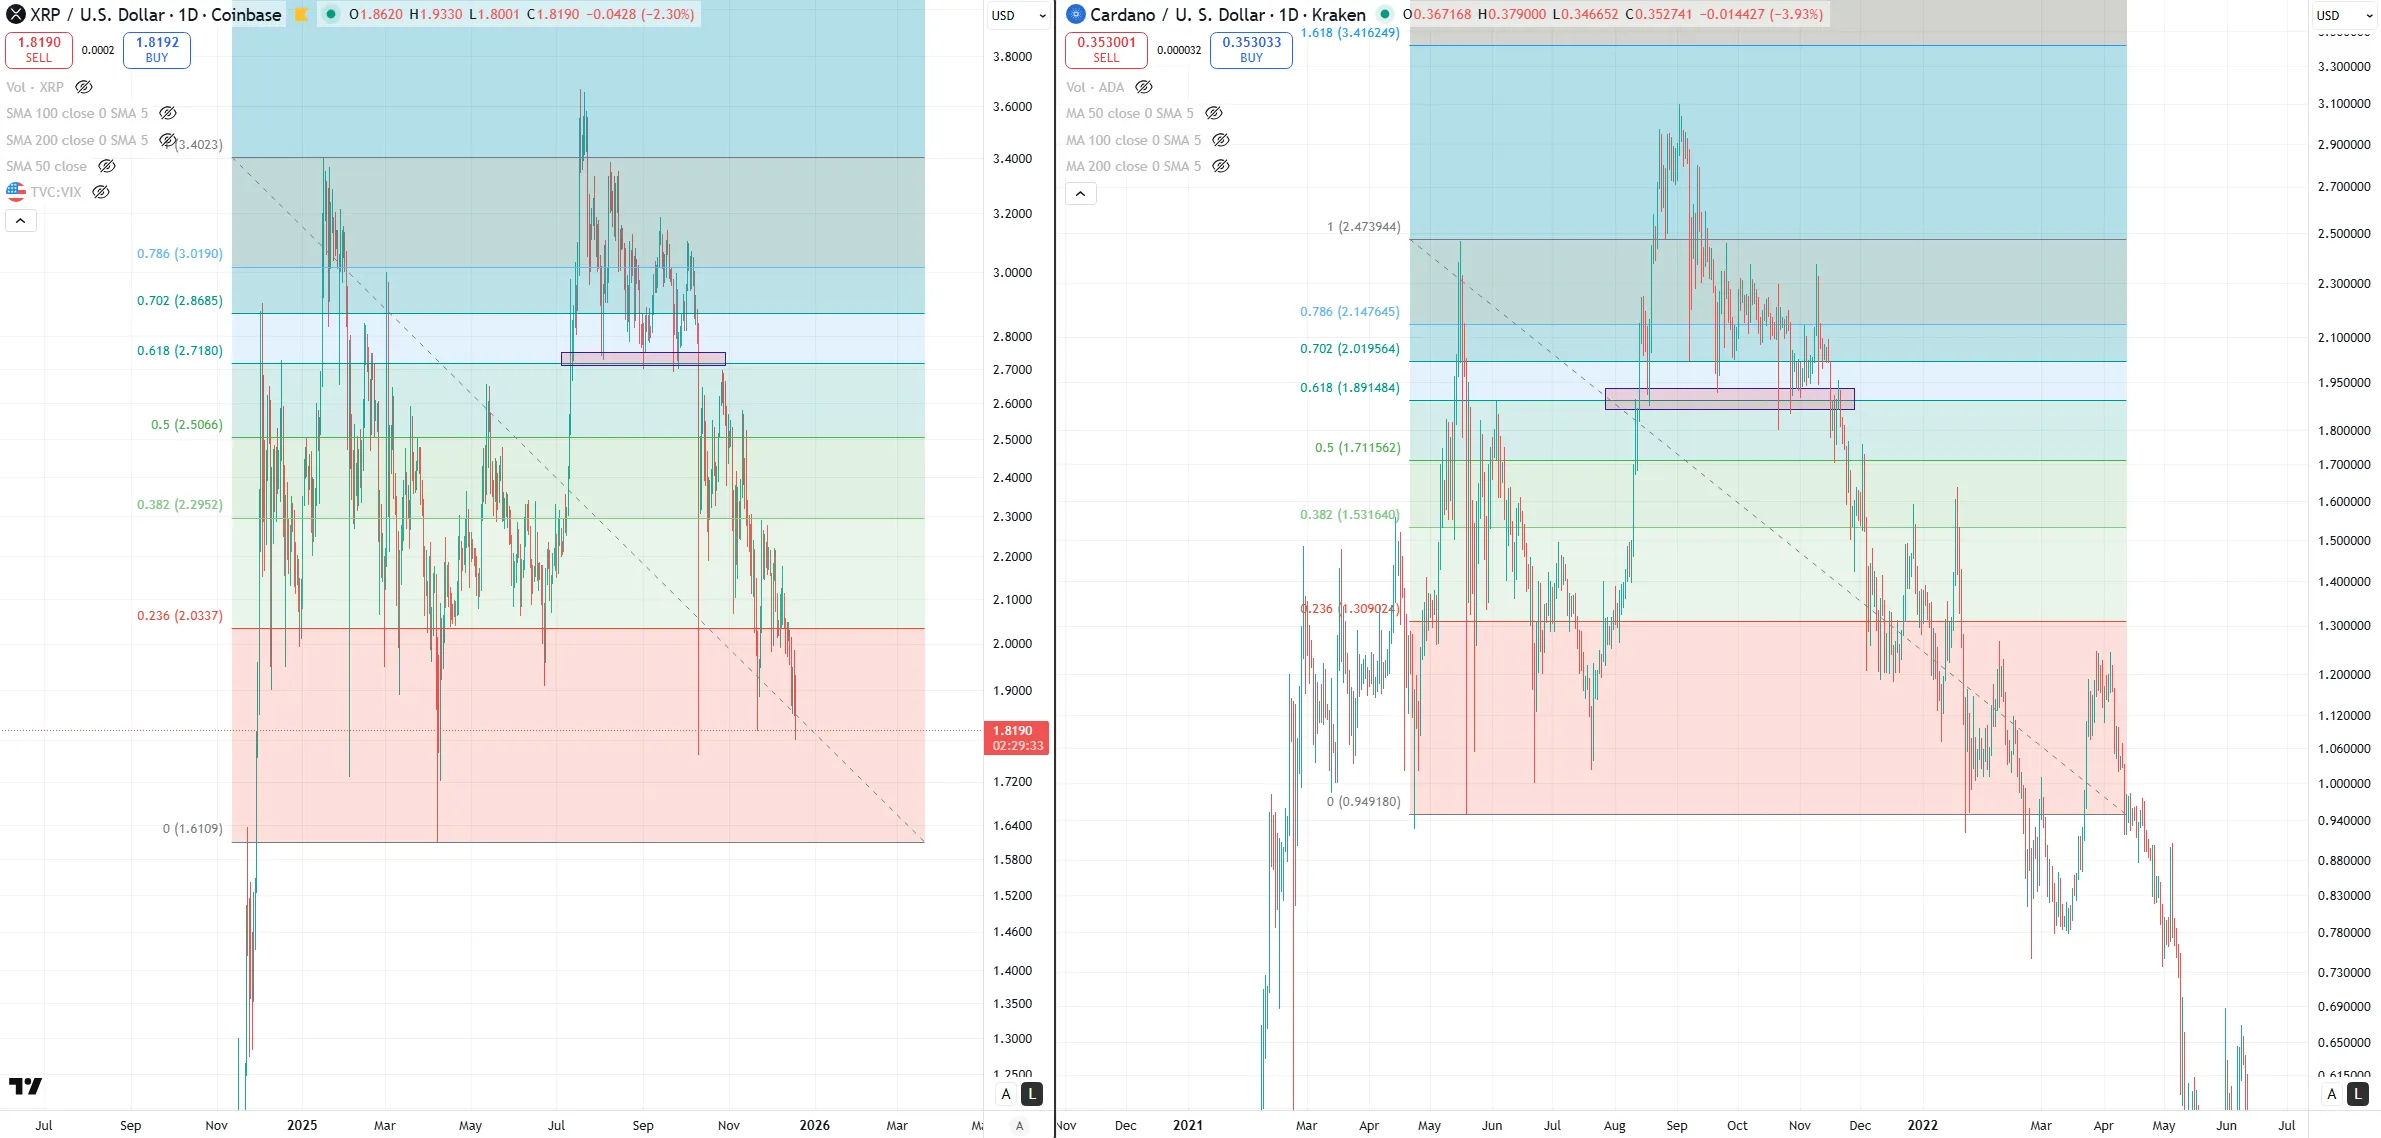
XRP Chart Compared to Cardano 2022 Price Action
For perspective, after Cardano reached its current all-time high of $3.10 in September 2021, it retested a previous support level around $1.82. The support cushioned the price weakness several times before it finally made way for bearish momentum in November 2021.
From there, Cardano fell through multiple Fibonacci levels after breaking down, reaching the bear market lows of $0.22.
Notably, XRP is following a similar trajectory. It broke out from a descending channel in early July, reaching a peak price of $3.66. After that, it retraced to revisit the support level around $2.72. After bouncing from the demand zone on three occasions, it finally broke down in early October, sparking a severe correction to its current price level.
Currently, the asset has broken through the 0.5, 0.382, and 0.236 Fibonacci levels at $2.50, $2.29, and $2.03, respectively. If XRP continues to follow this pattern, it could drop to the next Fibonacci level at $1.61, representing a 13.4% correction.
Nonetheless, there are conflicting price predictions for XRP. For context, Egrag Crypto predicted that the bounce from $1.83 in the past 24 hours could represent the end of a breakout retest for XRP. The targets for his analysis are $3.72, $9, and $27.