




- $ALGO broke out of a descending pattern and surged 20% into a fourth straight daily gain.
- Price now tests the $0.10-$0.11 zone as trading volume falls and momentum meets resistance.
- Open interest hit a yearly high, showing stronger derivatives activity despite spot caution.
$ALGO extended its rally into a fourth straight day after breaking above a descending pattern that had reinforced a bearish structure. The move turned market attention toward whether the token could preserve its momentum at a historically important price area.
The breakout was followed by a roughly 20% climb to about $0.1125, a zone last seen on Jan. 31. That level aligned with the 50% Fibonacci retracement and triggered a pullback of more than 5% from the local peak.
Resistance Emerges After Sharp Four-Day Advance
At press time, $ALGO traded at $0.1071, up about 5% over the past 24 hours, with a market capitalization of $953.15 million. The token still held most of its breakout gains even after easing from its latest high.
The broader weekly picture also reflected renewed strength. $ALGO posted gains of roughly 27% over the week, although it remained down about 38% on a year-to-year basis. That combination showed improving short-term sentiment against a still-weaker long-term backdrop.
Trading activity, however, did not fully match the price rise. Volume fell 22.16% to around $127.98 million, indicating that participation cooled even as the token advanced. The latest price action placed the asset inside a resistance zone around $0.10 to $0.11.
That range now stands at the center of the current structure. It capped the latest push higher and overlapped with the 50% Fibonacci level near $0.1126. The reaction there suggested that buyers met heavier selling pressure as the rally approached a key barrier.
Derivatives Data Shows Rising Participation
While spot volume declined, derivatives data pointed to stronger positioning. CoinGlass data showed open interest rising 5.52% over the past 24 hours to $56.72 million, its highest level this year.

$ALGO Derivatives Open Interest (Source: CoinGlass)
That increase indicated fresh capital entering the derivatives market rather than a wave of position closures. It also suggested that traders were maintaining exposure during the rally instead of stepping aside after the breakout.
Derivatives volume added to that picture. It climbed to $513.46 million, marking an eight-month high and showing elevated activity around the tokens recent move. The jump underscored how closely traders were following price swings near resistance.

$ALGO Derivatives Volume (Source: CoinGlass)
The recent bullish tone also drew support from a separate narrative around blockchain resilience. According to an official report, Google Quantum AI cited the project more than 32 times in a paper on quantum threats facing major blockchains.
The document placed the project just behind Bitcoin and Ethereum in references tied to proactive work on post-quantum cryptography. That mention added another layer of visibility as the market tracked the tokens breakout and derivatives expansion.
$ALGO Technical Readings Highlight a Crowded Zone
Meanwhile, from a technical standpoint, the daily chart showed RSI at about 70.82. That reading is commonly associated with overbought conditions and points to a market trading near an elevated momentum threshold.
The same reading did not erase the rally, but it showed that the advance had already become stretched by conventional momentum standards. With price holding near resistance, traders were left watching whether strength could persist without stronger spot participation.
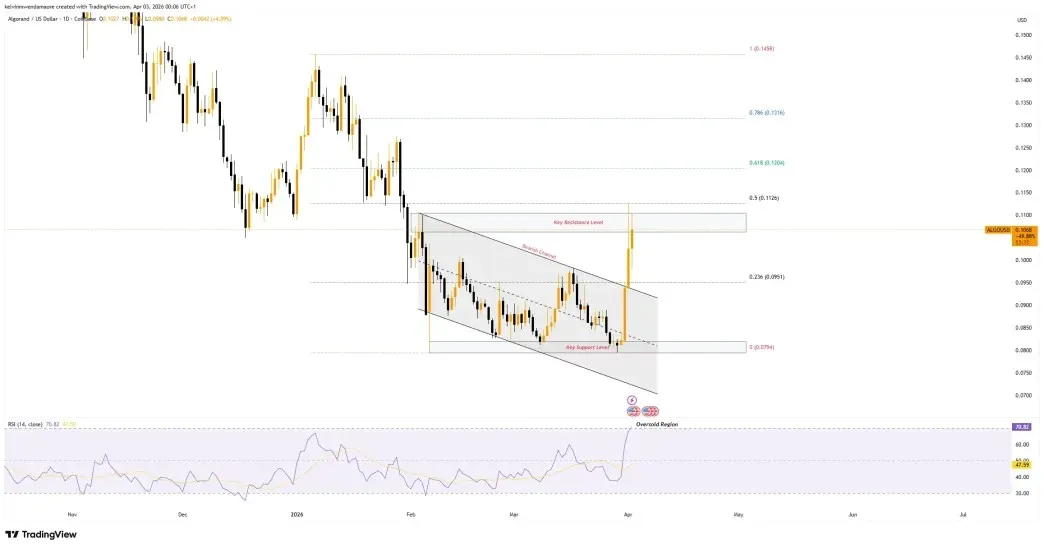
$ALGO 1-Day Price Chart (Source: TradingVolume)
For now, the chart presents clearly defined reference points. Resistance remains concentrated around $0.10 to $0.11 and at the 50% Fibonacci level near $0.1126, while $0.1204 marks the 61.8% retracement above.
Below the market, the first support level sits around $0.0951, which matches the 23.6% Fibonacci retracement. A deeper support area stands around $0.08 to $0.07, a zone that has repeatedly contained this years downside pressure.
Also Read: Chainlink Price Falls 3.5% as Altcoin Selloff Intensifies