Bitcoin has entered a consolidation phase after a sharp sell-off in November last year. While the broader trend remains under pressure, short-term price action is compressing within a tightening structure. With flashing signs of weakened demand from U.S. spot buyers and prices stuck below major moving averages, BTC traders need to keep a close eye on support levels and whether buyers can regain momentum from here.
Bitcoin Price Analysis: The Daily Chart
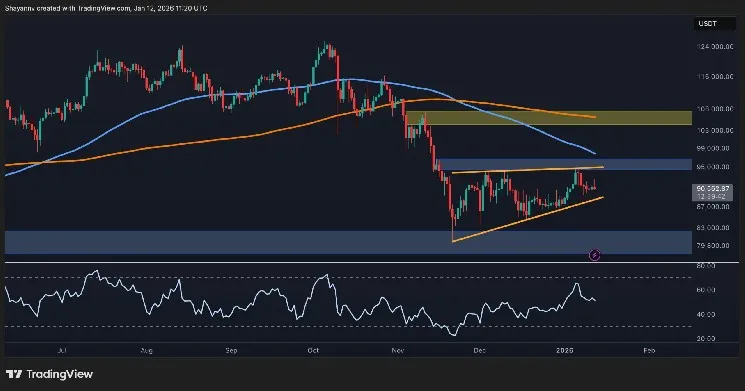
On the daily timeframe, BTC is forming a clear rising wedge pattern after its recent rebound stalled just below the $95K resistance zone. The pattern is getting tighter, with both the higher and lower boundaries being tested multiple times, hinting that a breakout is nearing. Both the 100-day and 200-day moving averages also remain above the current price, acting as dynamic resistance near $98K and $105K marks, respectively.
Bitcoin‘s price was recently rejected from $95K supply zone, which coincides with the wedge pattern’s upper boundary. The RSI has also cooled off from overbought levels and is now hovering around 50, indicating a lack of bullish momentum but also room for a potential push if buyers return.
In this situation, if the wedge breaks to the downside, the next key support lies around the $80K area. A bullish breakout, on the other hand, would need to reclaim $95K and push above the mentioned moving averages before it can be taken as a serious sign of a new rally.
BTC/USDT 4-Hour Chart
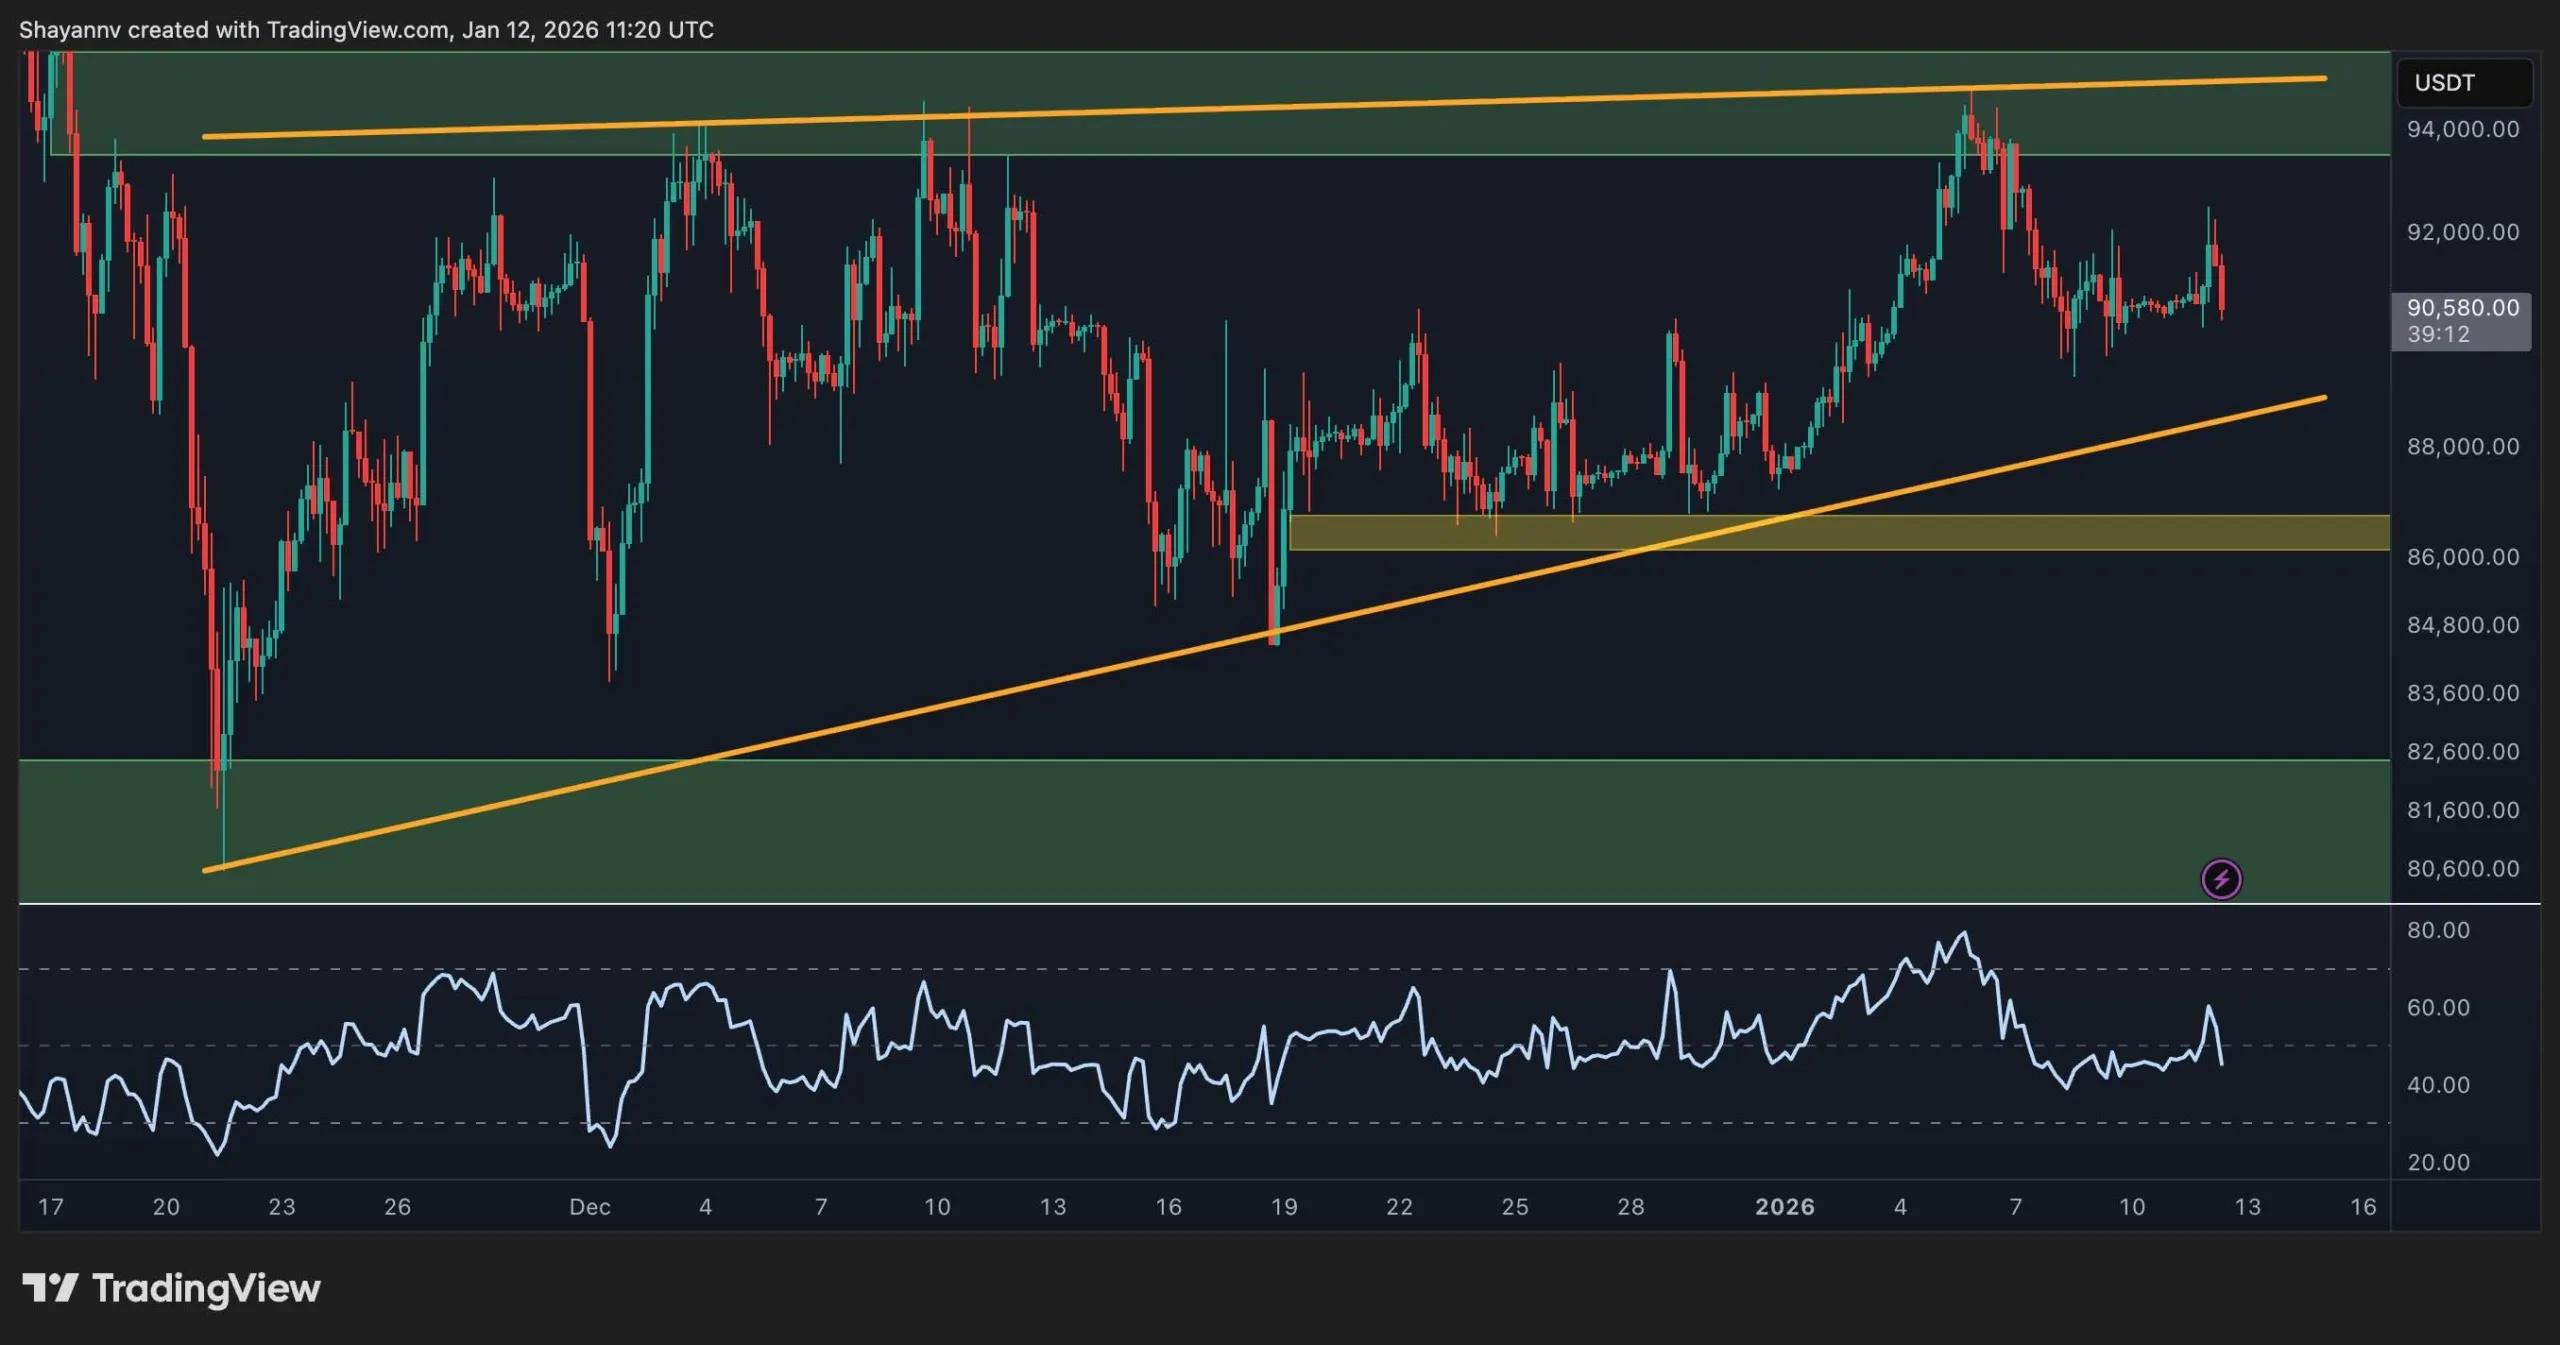
Zooming into the 4-hour chart, the same rising wedge structure is more visible. The price continues to respect the rising trendline from Novembers low, but multiple attempts to break above $95K have failed.
Momentum on lower timeframes is choppy, with no clear follow-through from either side. Buyers defended the mid-range and the rising trendline several times, but the lack of strength near resistance is concerning.
A breakdown below the lower boundary near $88K would likely trigger a retest of the high-volume node near $86K and possibly push BTC toward the major green demand zone around $80K. On the flip side, if buyers manage to reclaim the $92K high and break above the key $95K resistance zone, an aggressive move toward the critical $100K level could be expected.
Sentiment Analysis
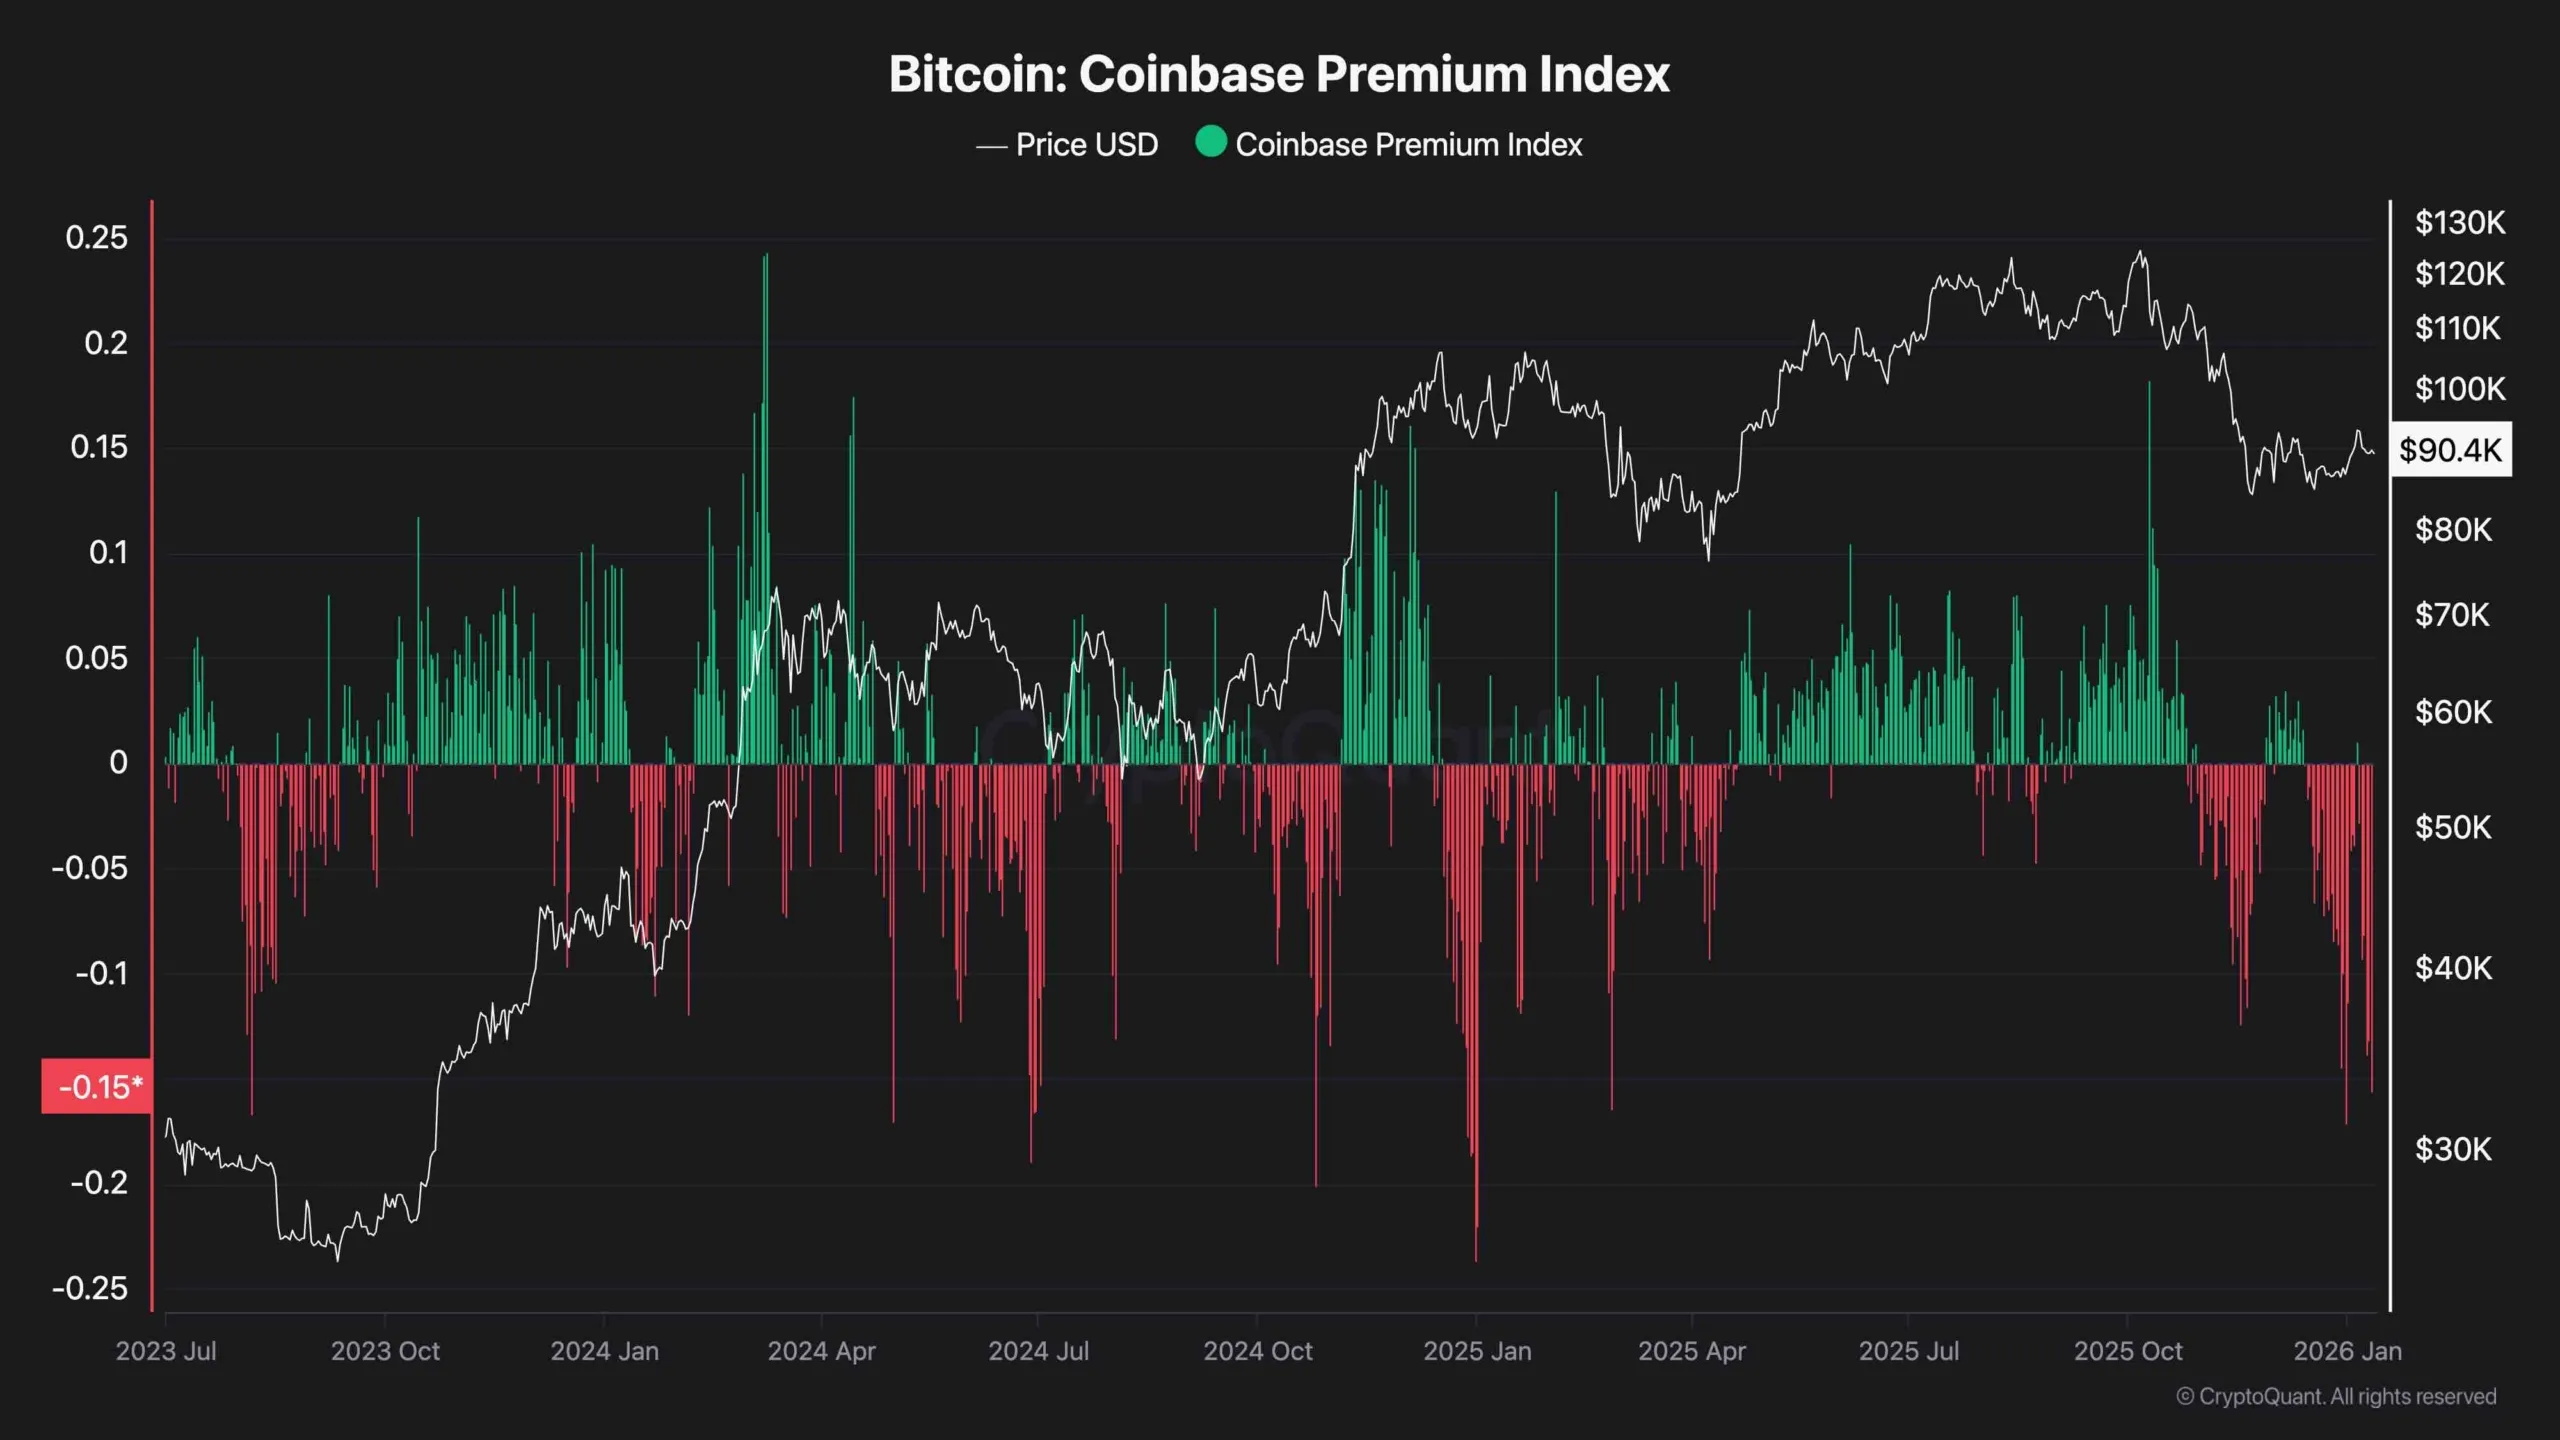
The Coinbase Premium Index, which tracks the price difference between Coinbase and global exchanges, has been printing significant negative values and still remains in the red. Historically, strong positive premiums have accompanied major uptrends, especially when driven by U.S.-based spot buyers.
The current negative premium suggests reduced demand from U.S. institutional and retail players, a potential warning sign that the recent bounce might not be sustainable. This metric has often preceded deeper pullbacks during correction phases. Until the premium shifts back to positive territory, any bullish move should be treated with caution.