






In brief
- Bitcoin rebounded 1.38% to $82,837 on Friday after dipping to $80,427 on Thursday, while total crypto market cap rose 2% to $2.8 trillion and the Fear & Greed Index fell to a neutral 56.
- Bitcoin ETFs shed $484.9 million on Wednesday and $244 million on Thursday as the 10-year Treasury yield hit 5.32%, and Fed minutes point to another hike by year-end.
- Myriad traders give a 67% chance Bitcoin trades at or below $80,000 before October ends.
The crypto markets are breathing today, with the total capitalization up 2.1% to $2.89 trillion on Friday. The bounce recovers only part of the damage, since the market stood above $3 trillion a week ago, when Bitcoin was pressing against its yearly high.
Despite the recovery, traders are still nervous. The Fear & Greed Index dropped to 56, a neutral reading, down from the 71 that put sentiment firmly in “greed” territory on October 2.
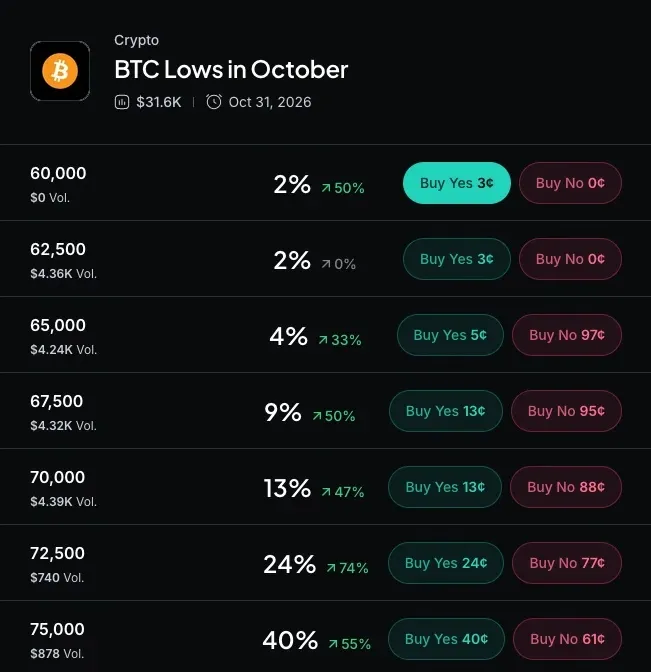
Myriad: How low will Bitcoin go? Click to make your prediction.
Wall Street is also nervous. Bitcoin ETFs alone shed $484.9 million on Wednesday, their worst day since June 25, and a further $244 million on Thursday, according to Decrypt's ETF tracker.
Bitcoin trades around $82,837 on Friday, up 1.38% on the day, after dipping to $80,427 on Thursday, its lowest level since early September.
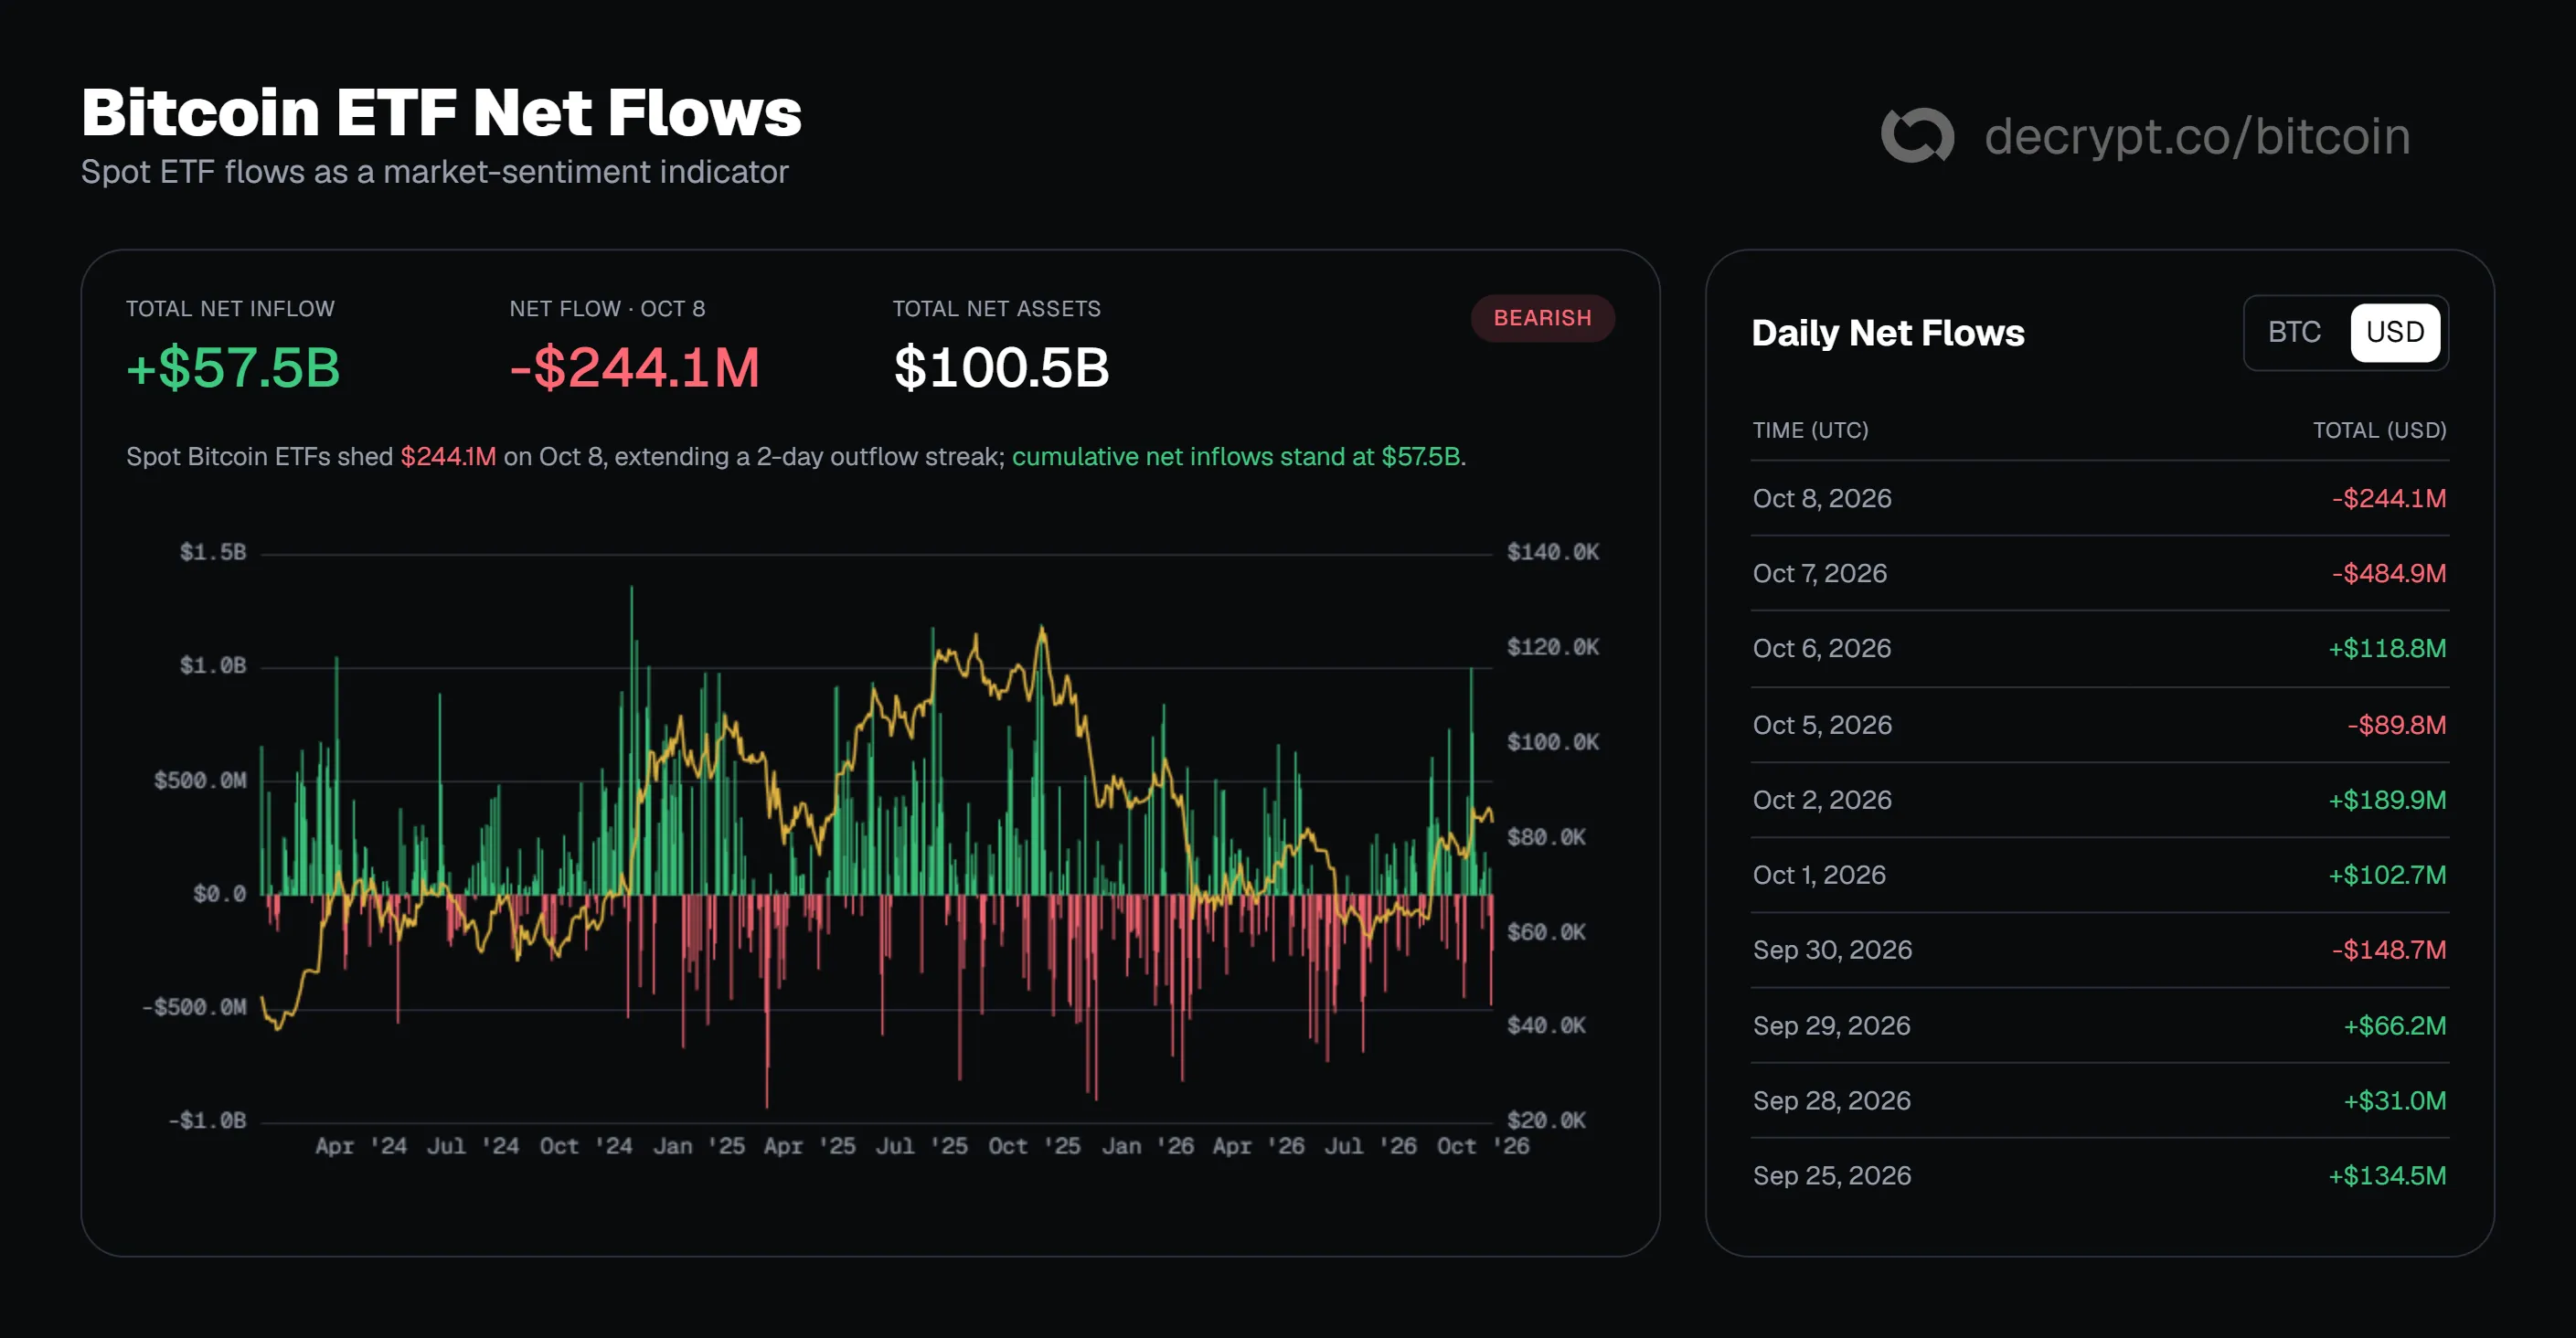
Bitcoin ETF flows. Image: Decrypt
The daily candle opened at $81,711 and has ranged between $81,553 and $83,443. On the four-hour chart, price still trades below the 50-period exponential moving average, so the short-term trend has not turned.
Myriad, a prediction market owned by Decrypt's parent company Dastan, gives a 67% chance that Bitcoin trades at or below $80,000 at some point in October, with 40% odds for $77,500 and 24% for $75,000.
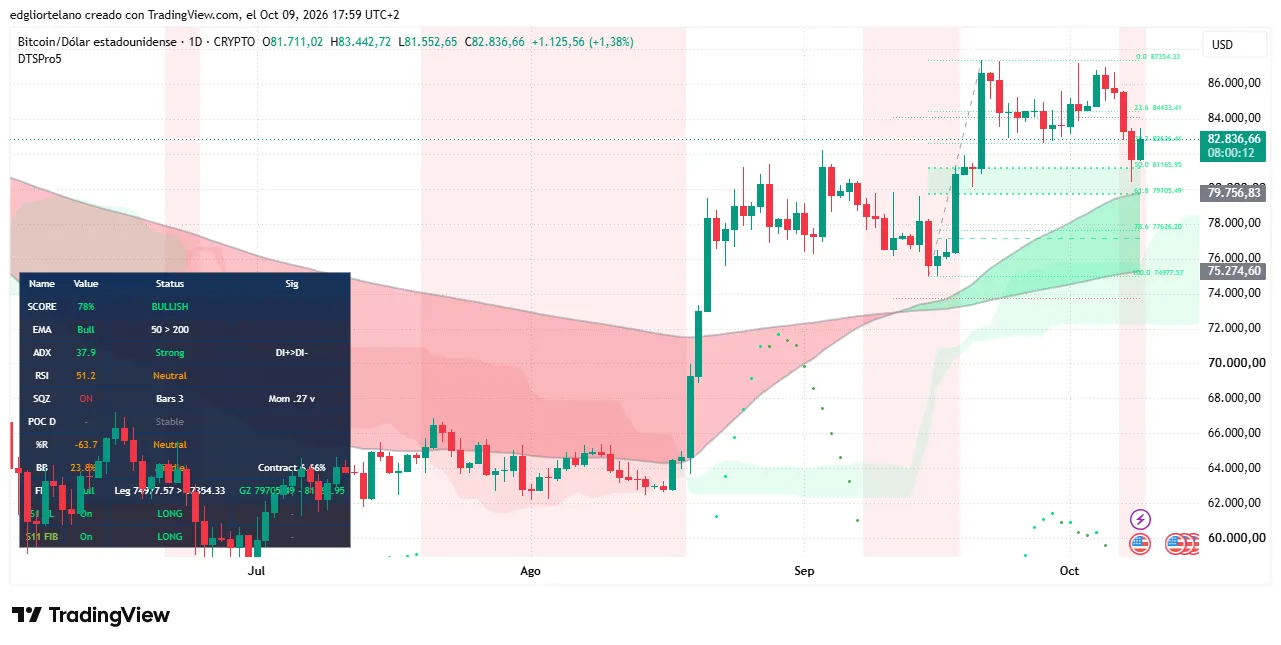
Bitcoin price data. Image: Tradingview
A separate weekly market put 49% odds on Bitcoin finishing the week above $87,500 so traders expect a month of price compression with some space for further downside.
The Average Directional Index, or ADX, which measures trend strength regardless of direction, reads 37.9 on the daily chart, well above the 25 level that confirms a real trend. The directional lines show buyers (DI+) above sellers (DI-), so the trend is still bullish even after the pullback.
The Relative Strength Index, or RSI, gauges buying pressure on a scale of 0 to 100, and its 51.2 reading is neutral, just like the Fear and Greed Index. This is worth checking out, because Bitcoin appears to be cooling down after an overbought phase.
Bitwise Europe's Luke Deans told Decrypt that the $83,000 zone combines the average ETF cost basis with the prior higher-high level, which makes it the first test for the bounce.
Reclaiming it would put the price zone at $84,433 in play, while the September high at $87,354.33 remains the ceiling bulls need a daily close above.
Daily Debrief Newsletter
Start every day with the top news stories right now, plus original features, a podcast, videos and more.
Your Email
Get it!
Get it!