





Bitcoin traders eye a re-test of resistance at $108,000, a daily candlestick close above this level could drive a potential breakout past the all-time high at $111,980. BTC should hold steady above $108,000 to end the ongoing consolidation. Institutional capital flows and relatively high correlation with BTC is likely to catalyze gains in top altcoins.
Table of Contents
- Bitcoin
- Ethereum
- XRP
- Sei
- Aptos
Bitcoin
Bitcoin (BTC) is trading 5% away from its all-time high. The $108,000 is a key resistance for BTC and once the crypto sees a daily candlestick close above this level, a re-test of $111,980 is likely.
On the BTC/USDT daily price chart key support levels are $106,290, $104,600 and $103,000. Resistance levels are the all-time high at $111,980 and the 127.2% Fibonacci retracement level at $122,172.
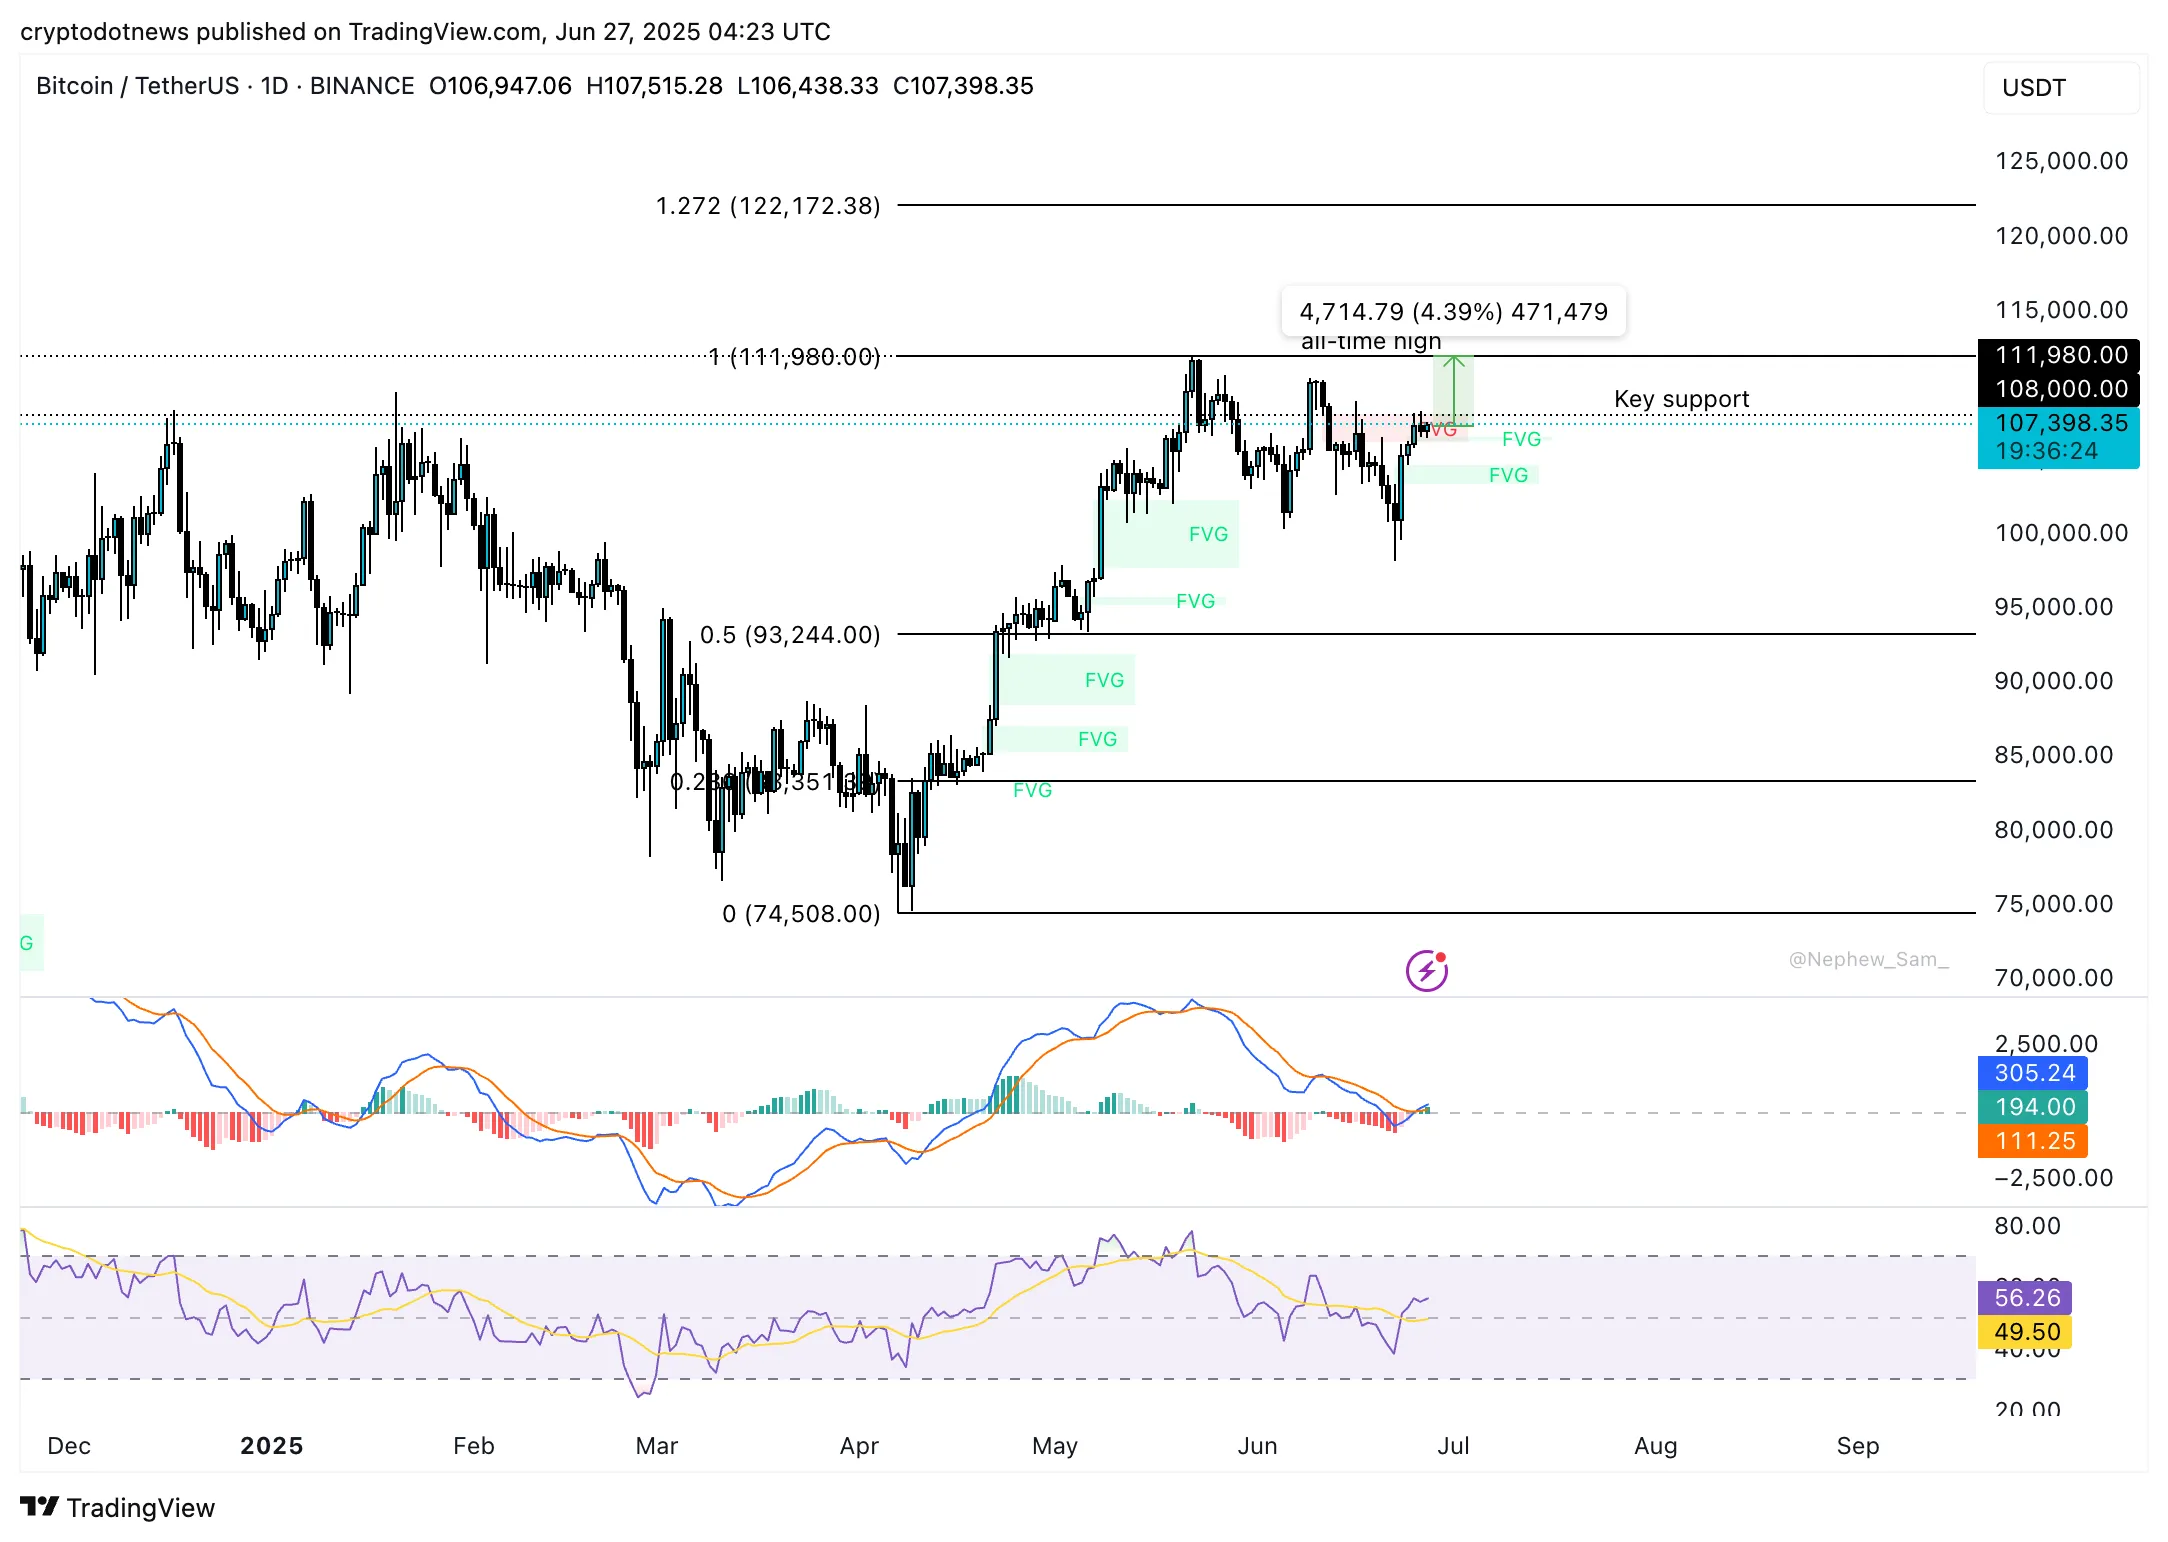
BTC/USDT daily price chart | Source: Crypto.news
Derivatives data shows that more long positions were liquidated relative to shorts, in the last 24 hours. Long/short ratio is less than 1, meaning than traders expect further correction in Bitcoin before a recovery in the crypto.
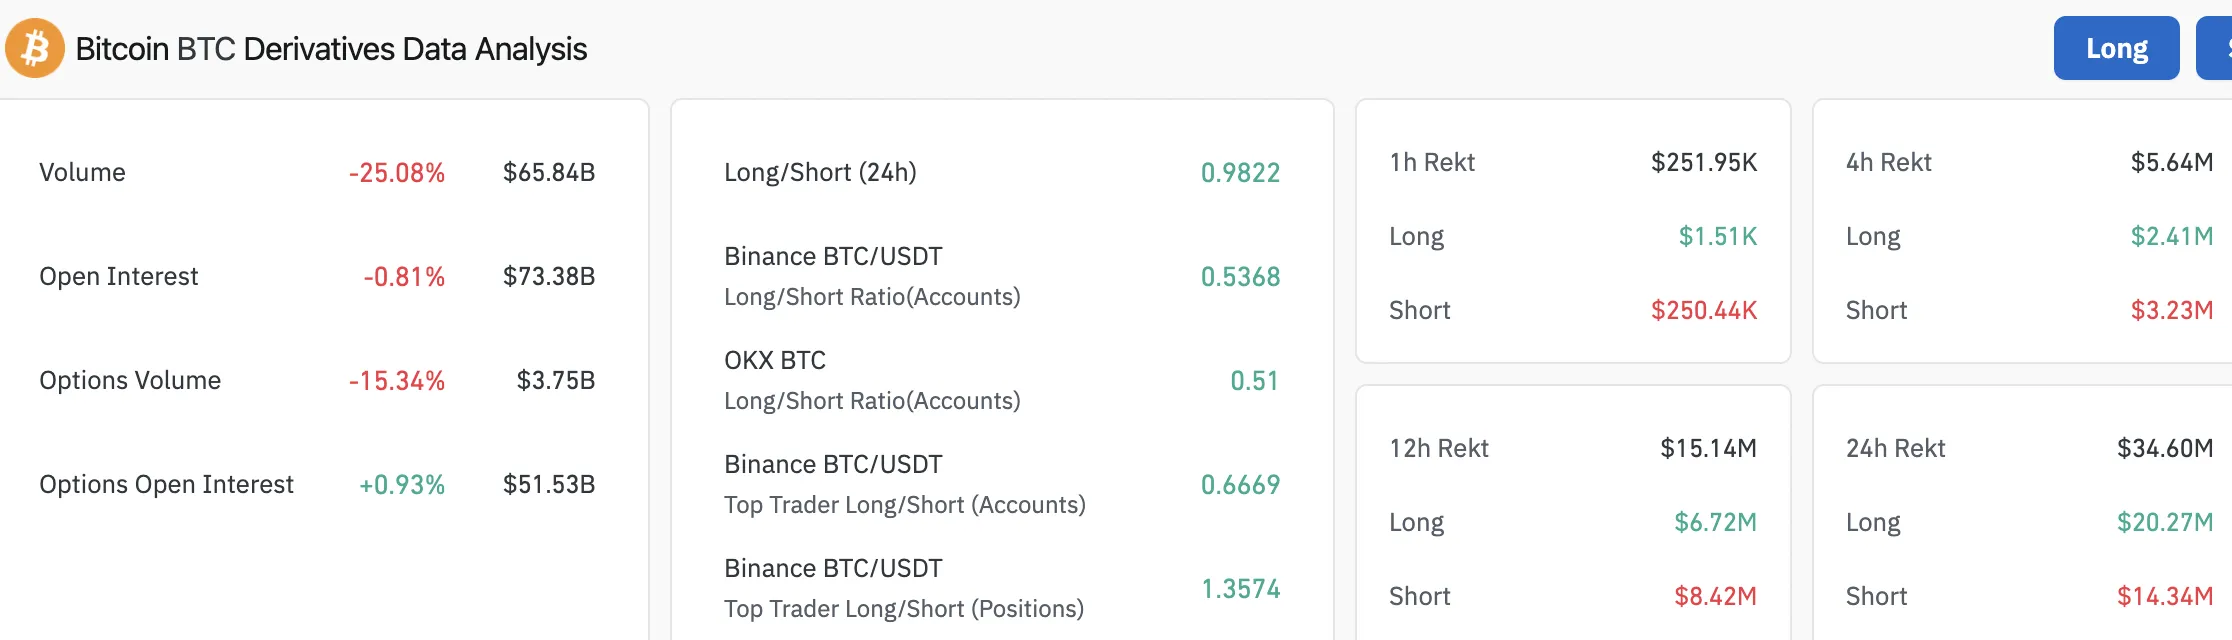
Bitcoin derivatives data analysis | Source: Coinglass
Bitcoin price action and the recent geopolitical events have turned traders less bullish than yesterday, however it is “greedy” on the Fear & Greed Index, meaning there is risk appetite among market participants.
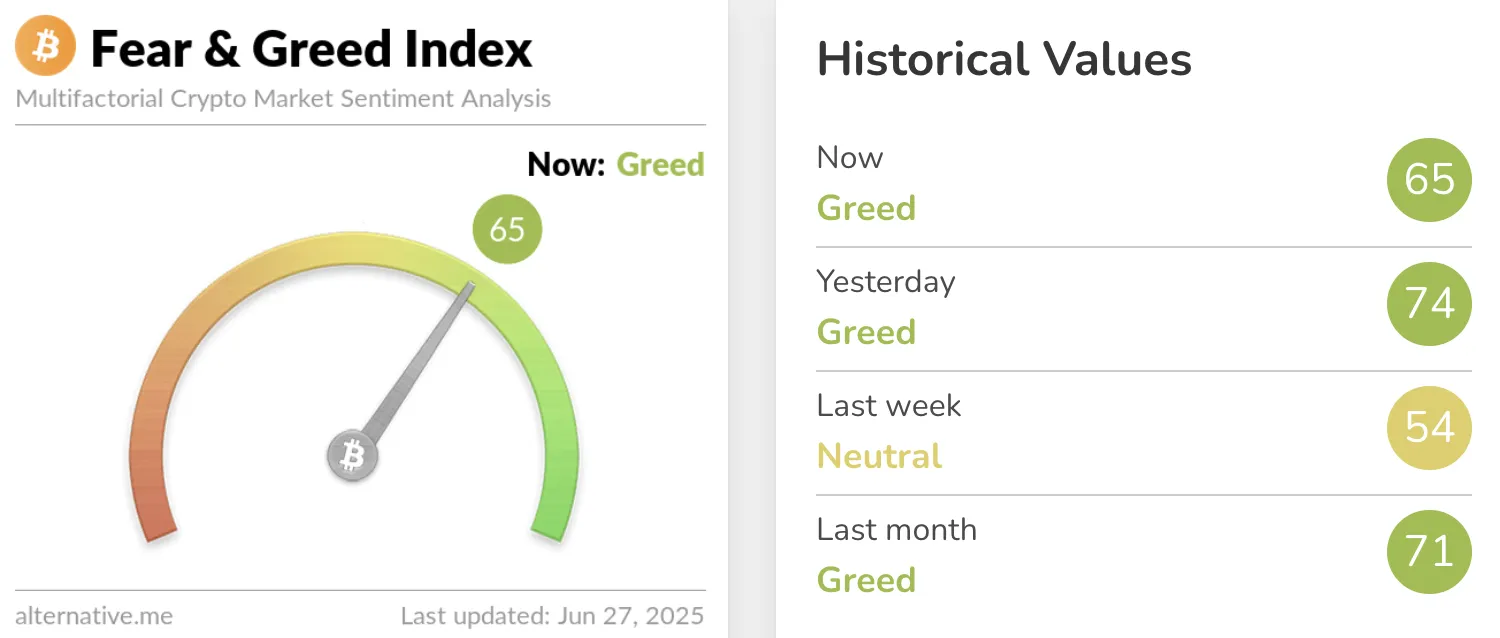
Crypto Fear & Greed Index | Source: Alternative
The $15 billion options expiry is another factor that could influence Bitcoin and altcoin prices over the weekend and next week. Typically a large volume options expiry induces volatility and Bitcoin could observe downward price swings. However, Bitcoin recovers the following week riding on consistent demand across spot exchange platforms.
The $106,000 support remains pivotal for Bitcoin. A drop under this level could induce further downside volatility in the largest crypto token.
You might also like: Mine Bitcoin, Ethereum without hardware using smart cloud mining
Ethereum
Ethereum (ETH) hovers around the $2,400 level, 12% below key resistance at $2,743. The $3,000 is another key resistance and a psychologically important level for Ethereum. Catalysts like ETH treasury allocation and institutional capital flows have failed to push Ether price higher.
A 30% rally from the current price could push Ethereum to test resistance at R1, $3,200. Another key resistance is R2, $3,600.
Important support levels are marked by Fair Value Gaps on the ETH/USDT daily price chart, and at $2,111 and $1,850.
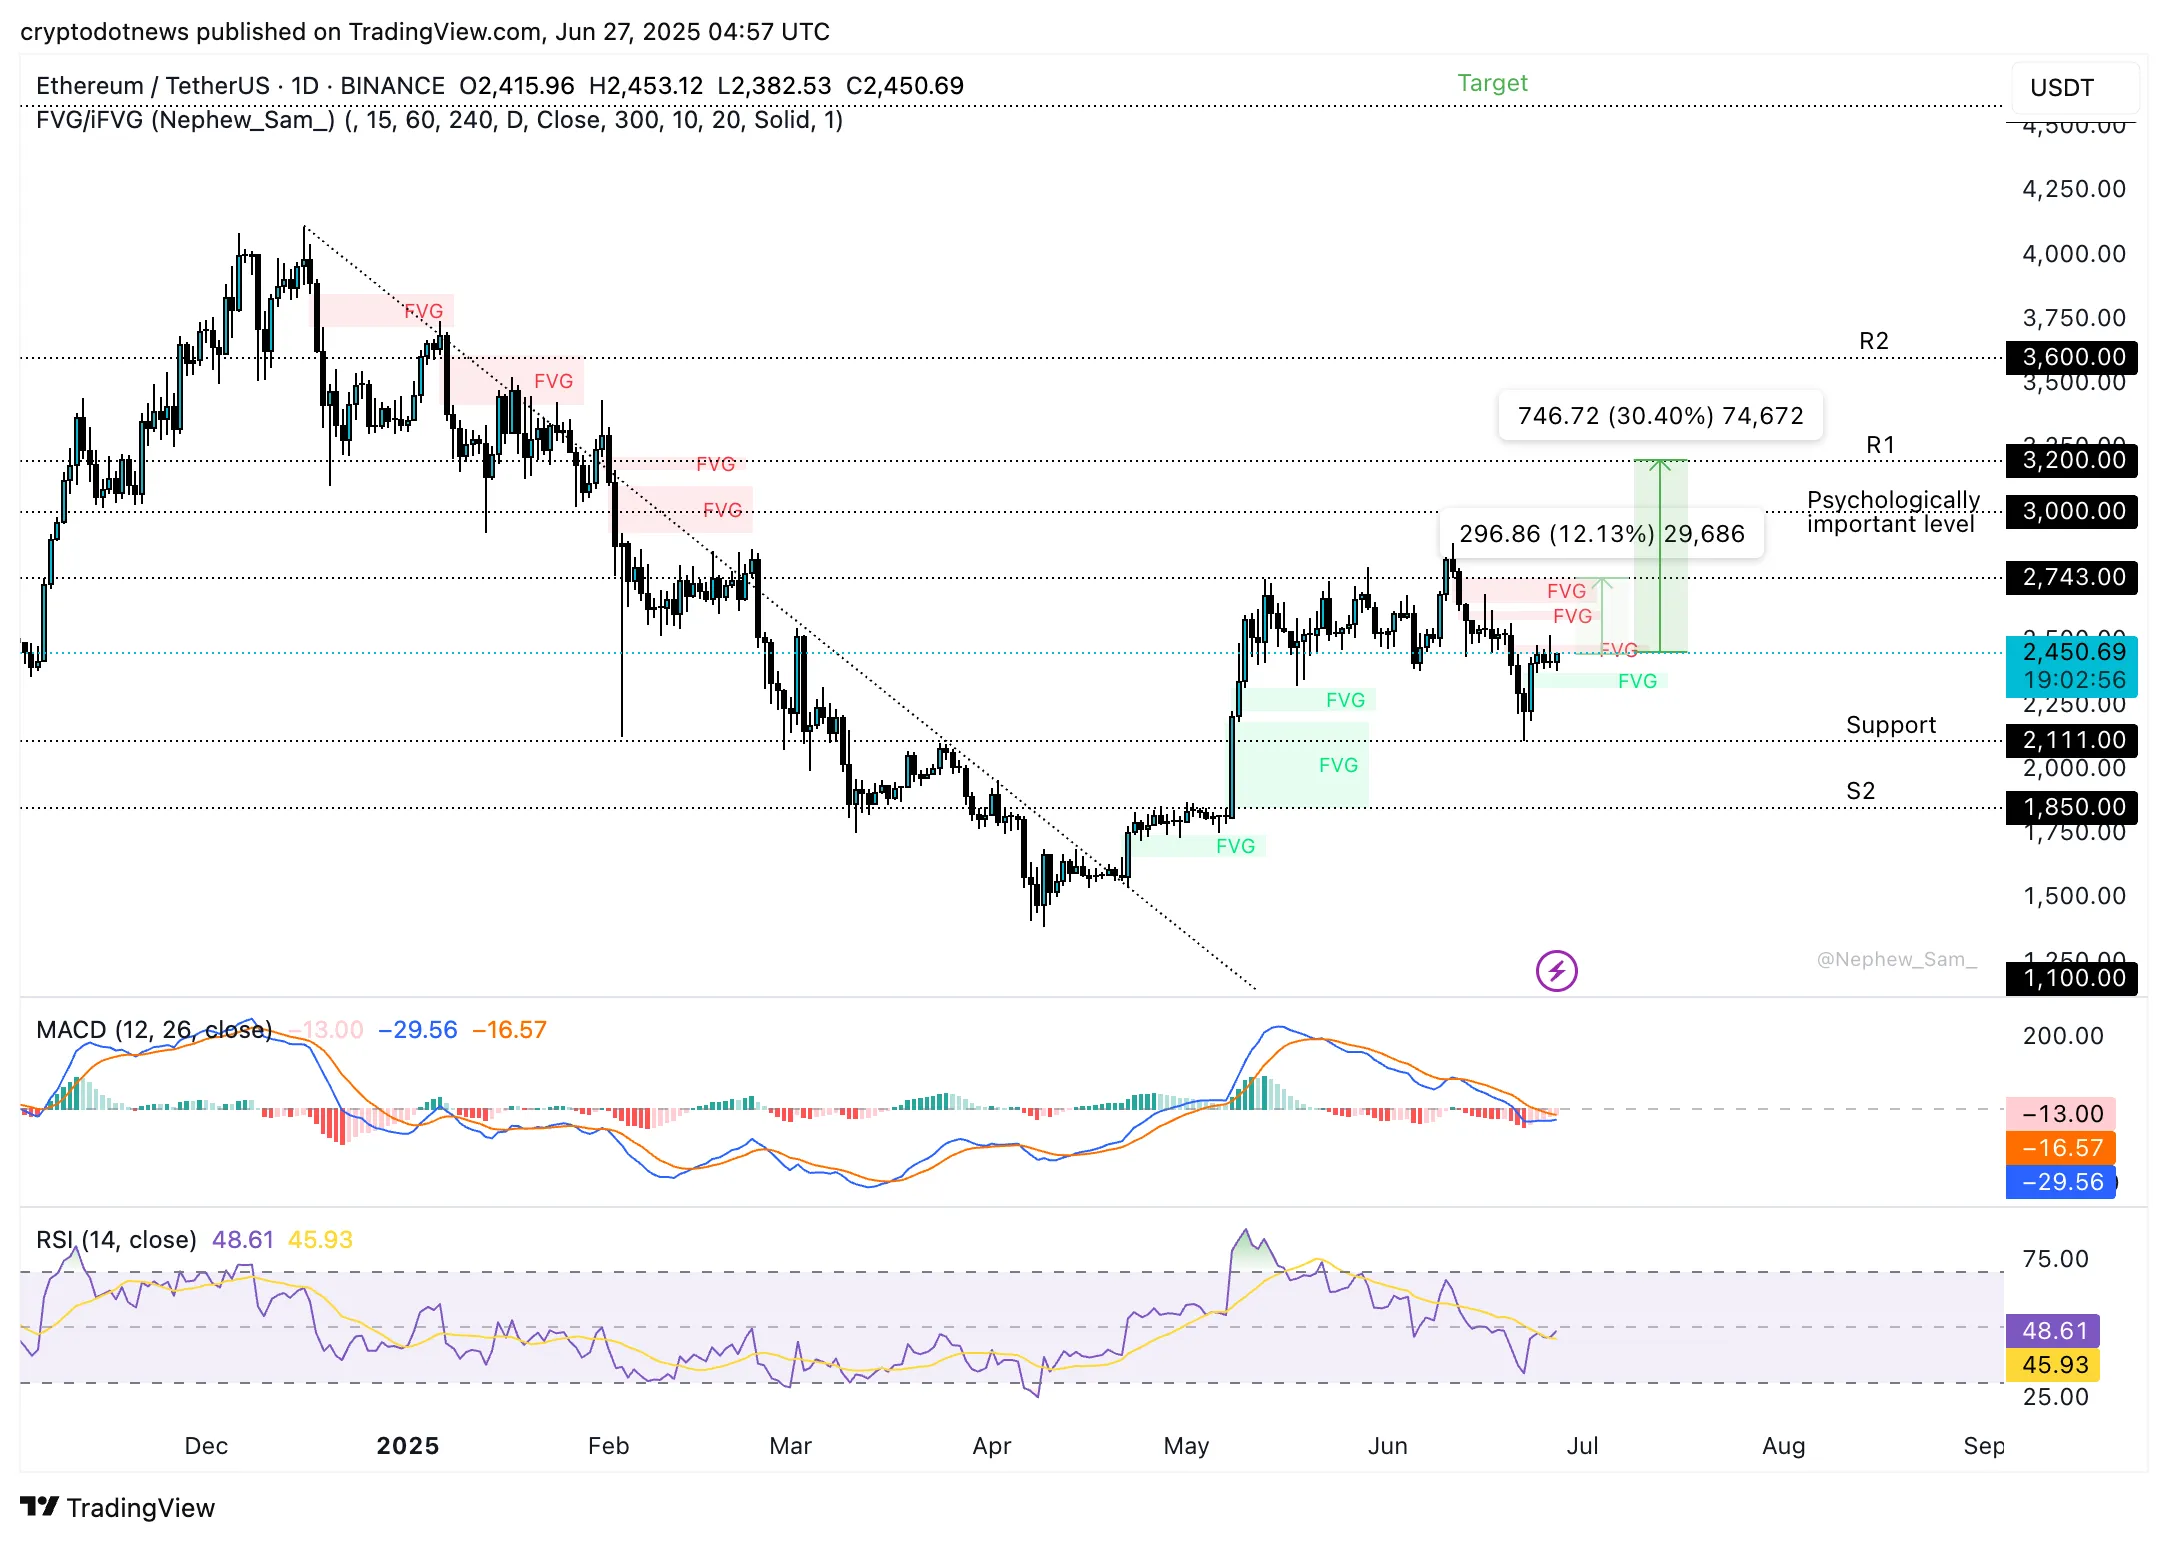
ETH/USDT daily price chart | Source: Crypto.news
Ripple‘s CTO David Schwartz recently said that the company plans to have a structure similar to Ethereum, for XRP. As the largest altcoin is the token of the decentralized web’s infrastructure chain, XRP is the native token of the XRPLedger and could become the underlying asset for the blockchain-based payment mechanism of Ripple.
You might also like: Mine Bitcoin, Ethereum without hardware using smart cloud mining
XRP
XRP/USDT daily price chart shows likelihood of gains in the altcoin. As Bitcoin hovers above $107,000 on Friday, it is likely that XRP rallies alongside the token. Key support and resistance levels are S1, S2 at $1.9083 and $1.7700, and R1 at $2.2524 and $2.6549.
The psychologically important $3 level is key to the altcoin. Technical indicators on the daily timeframe support gains in XRP.
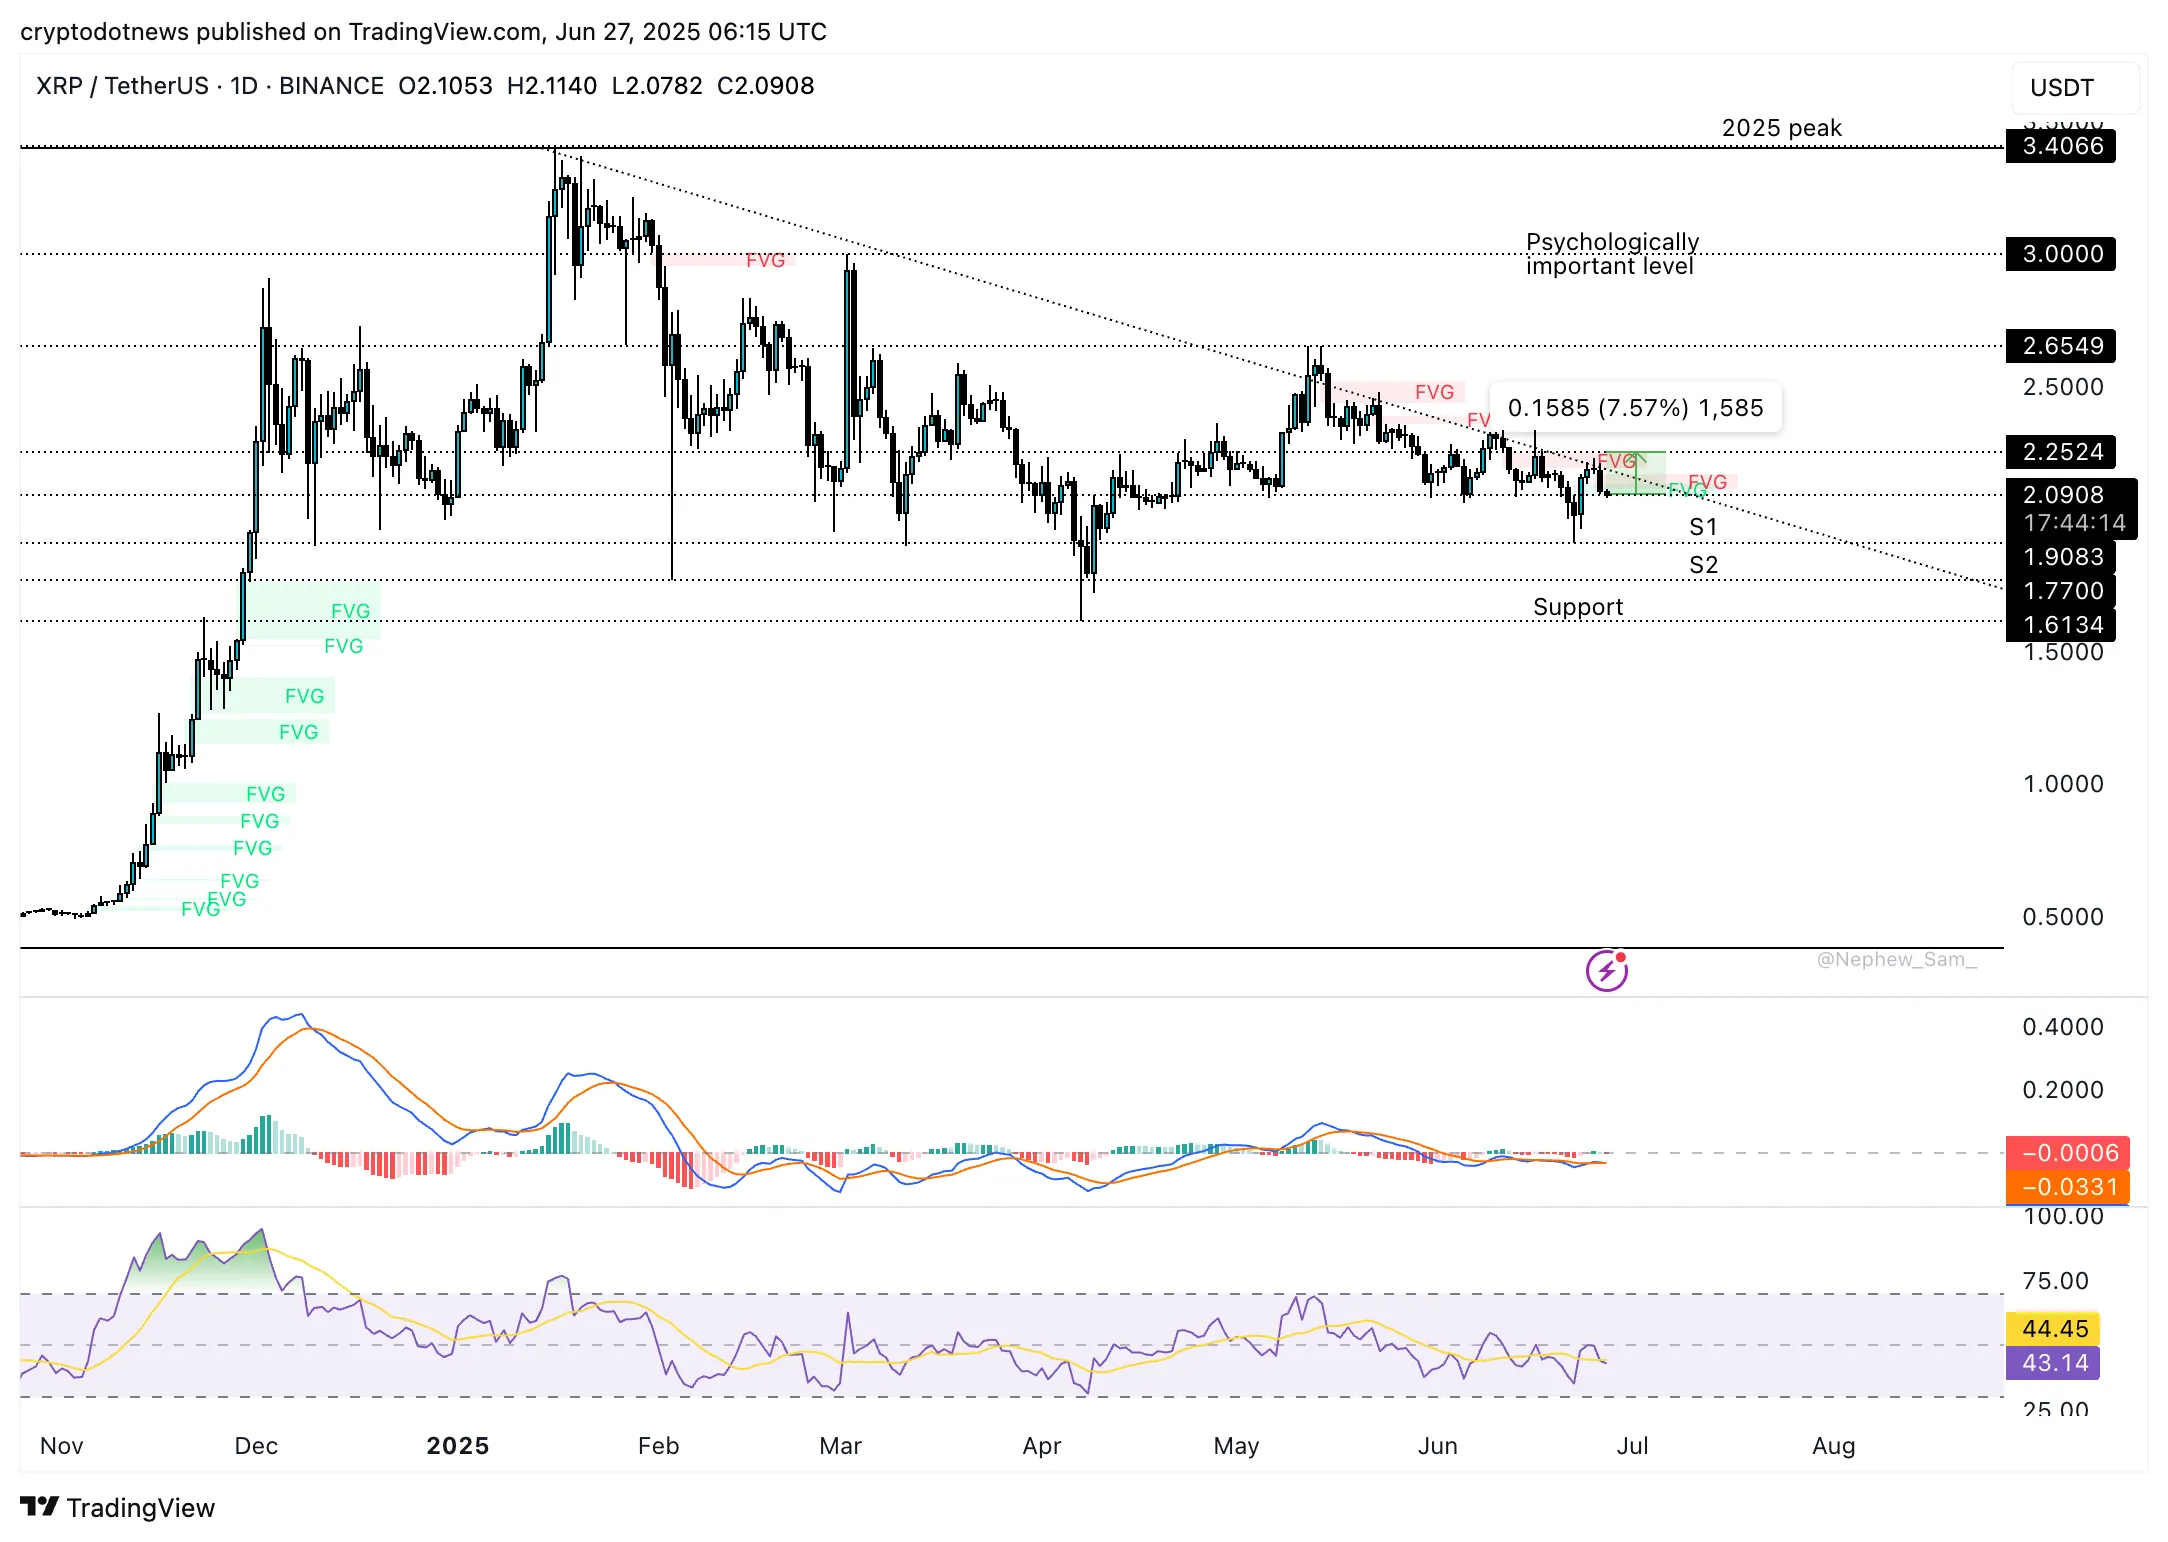
XRP/USDT daily price chart | Source: Crypto.news
Sei
SEI could gain nearly 14% and test resistance at $0.3359. Support at the upper and lower boundaries of the FVG at $0.2465 and $0.2650 is key to SEIs price trend. The token is currently consolidating under R1 at $0.3359.
RSI reads 66, meaning above neutral and MACD flashes green histogram bars above the neutral line.
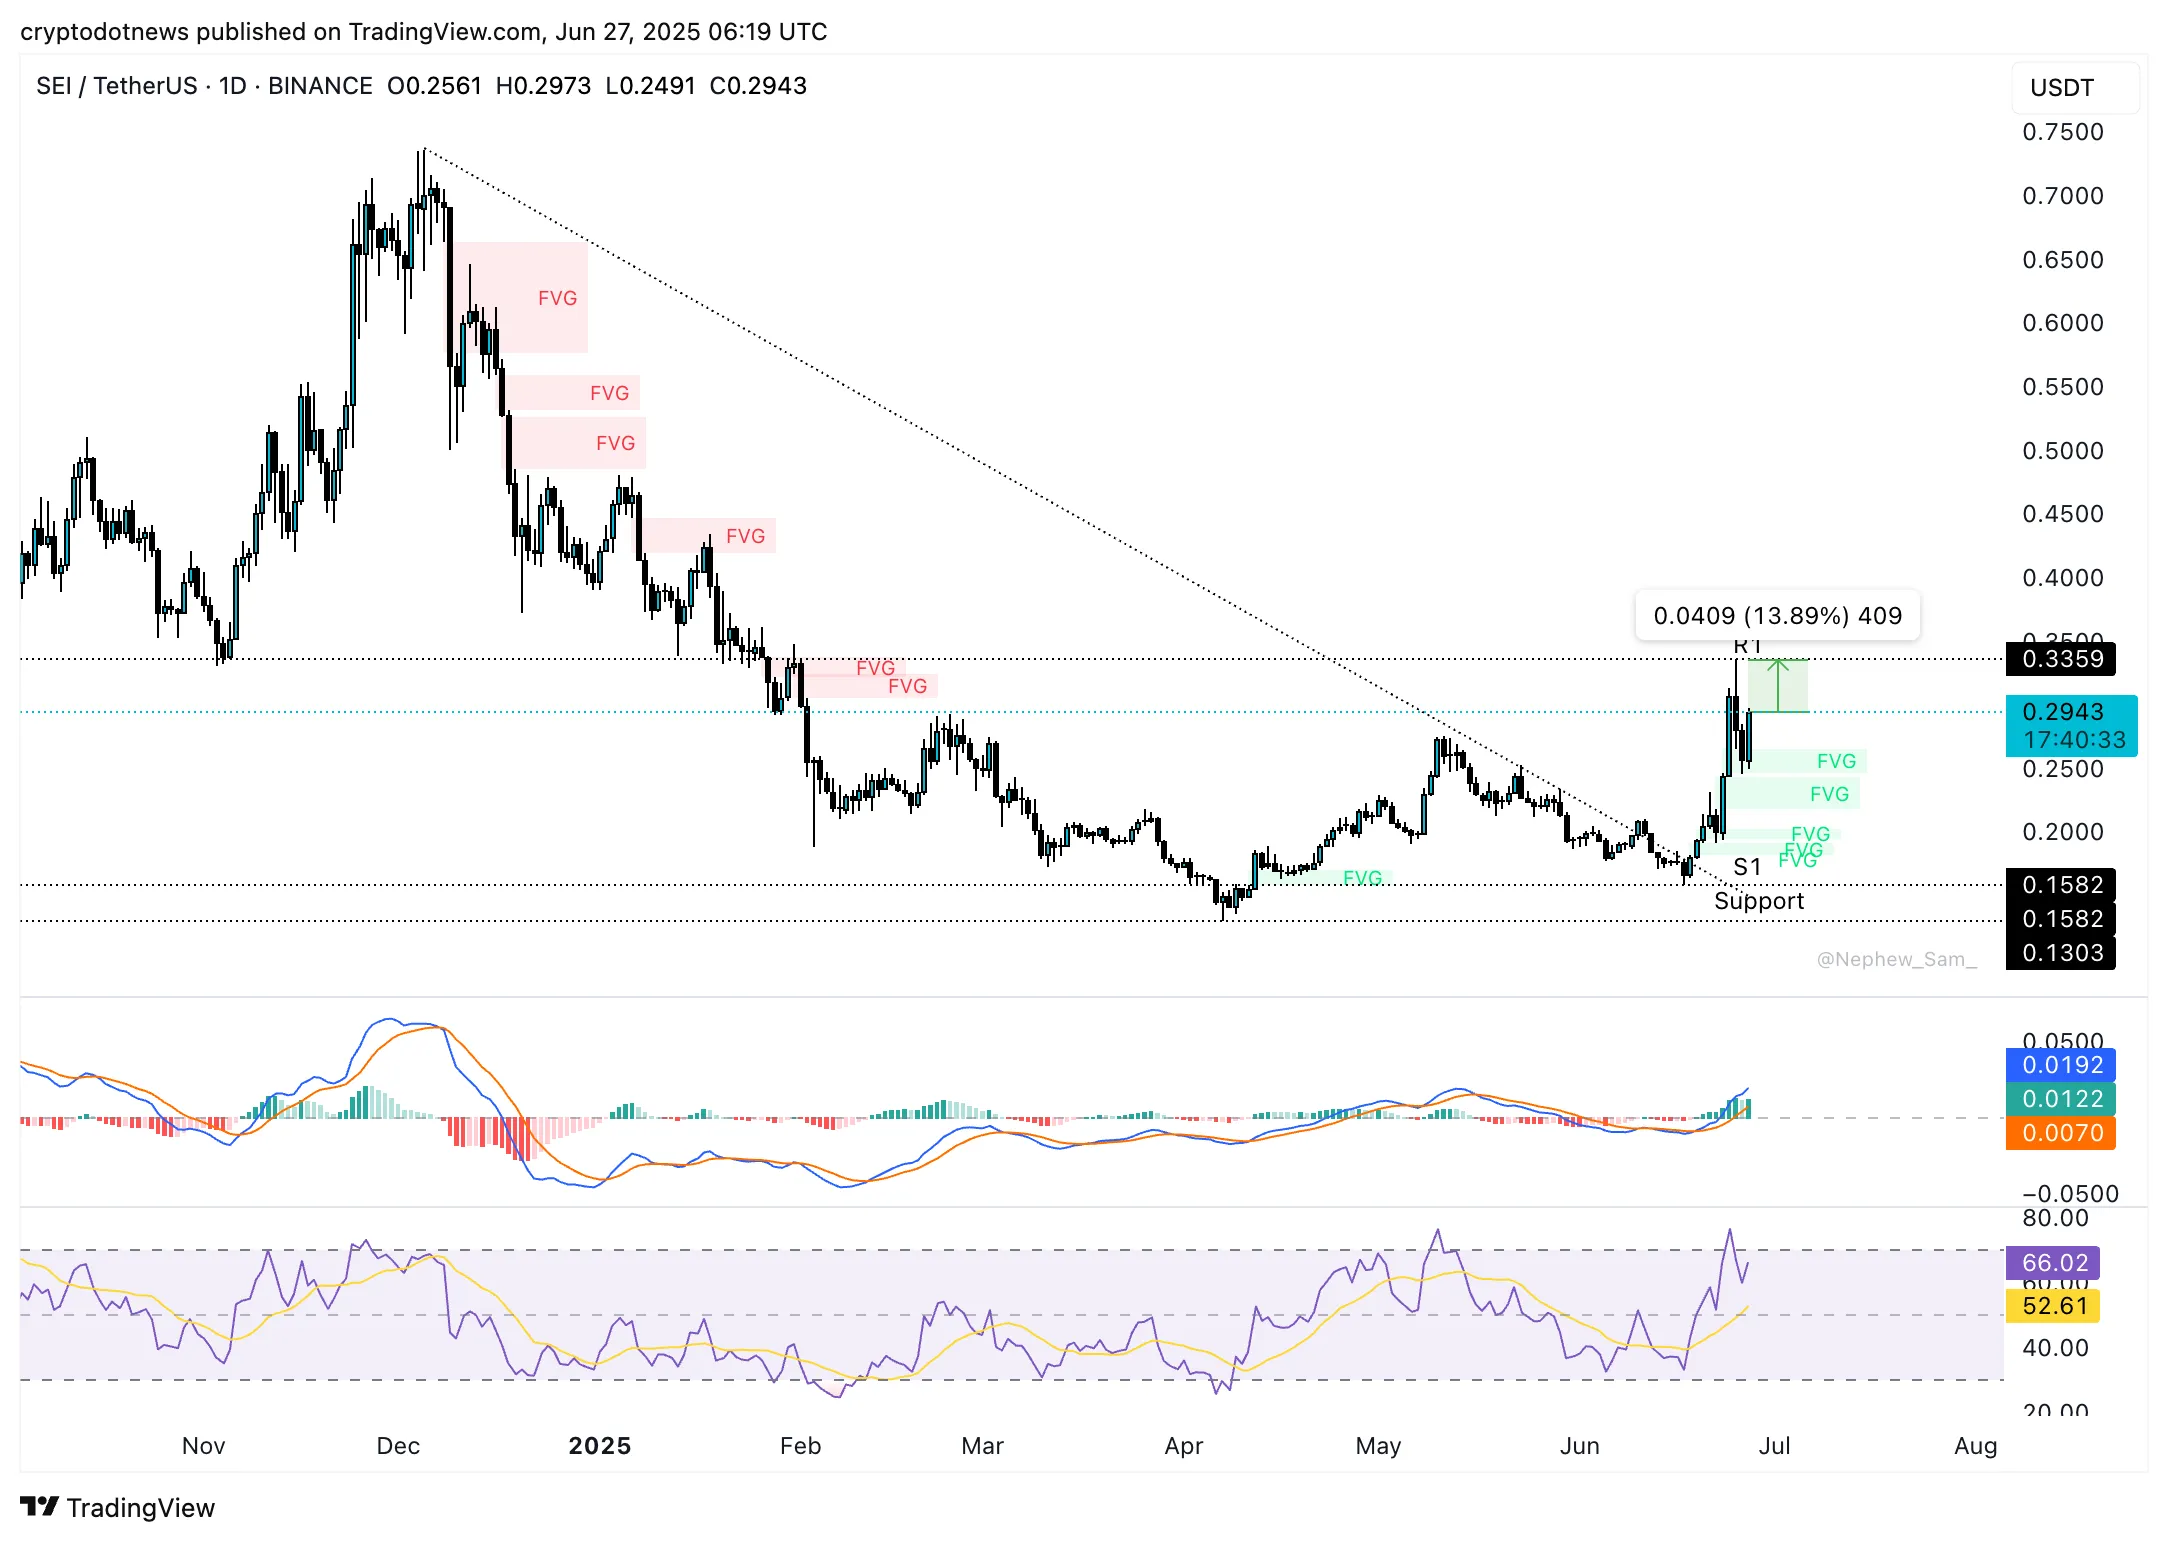
SEI/USDT daily price chart | Source: Crypto.news
Aptos
Aptos (APT) is trading above the $5 support level, at $5.142 on Friday. The token could collect liquidity at S1, at $4.644. The APT/USDT daily price chart shows signs of further gains in Aptos. RSI reads 58 and is sloping upwards, and MACD flashes green histogram bars above the neutral line.
Nearly 17% rally could push APT to test resistance at R1, $6. The next key resistance is R2, at $7.
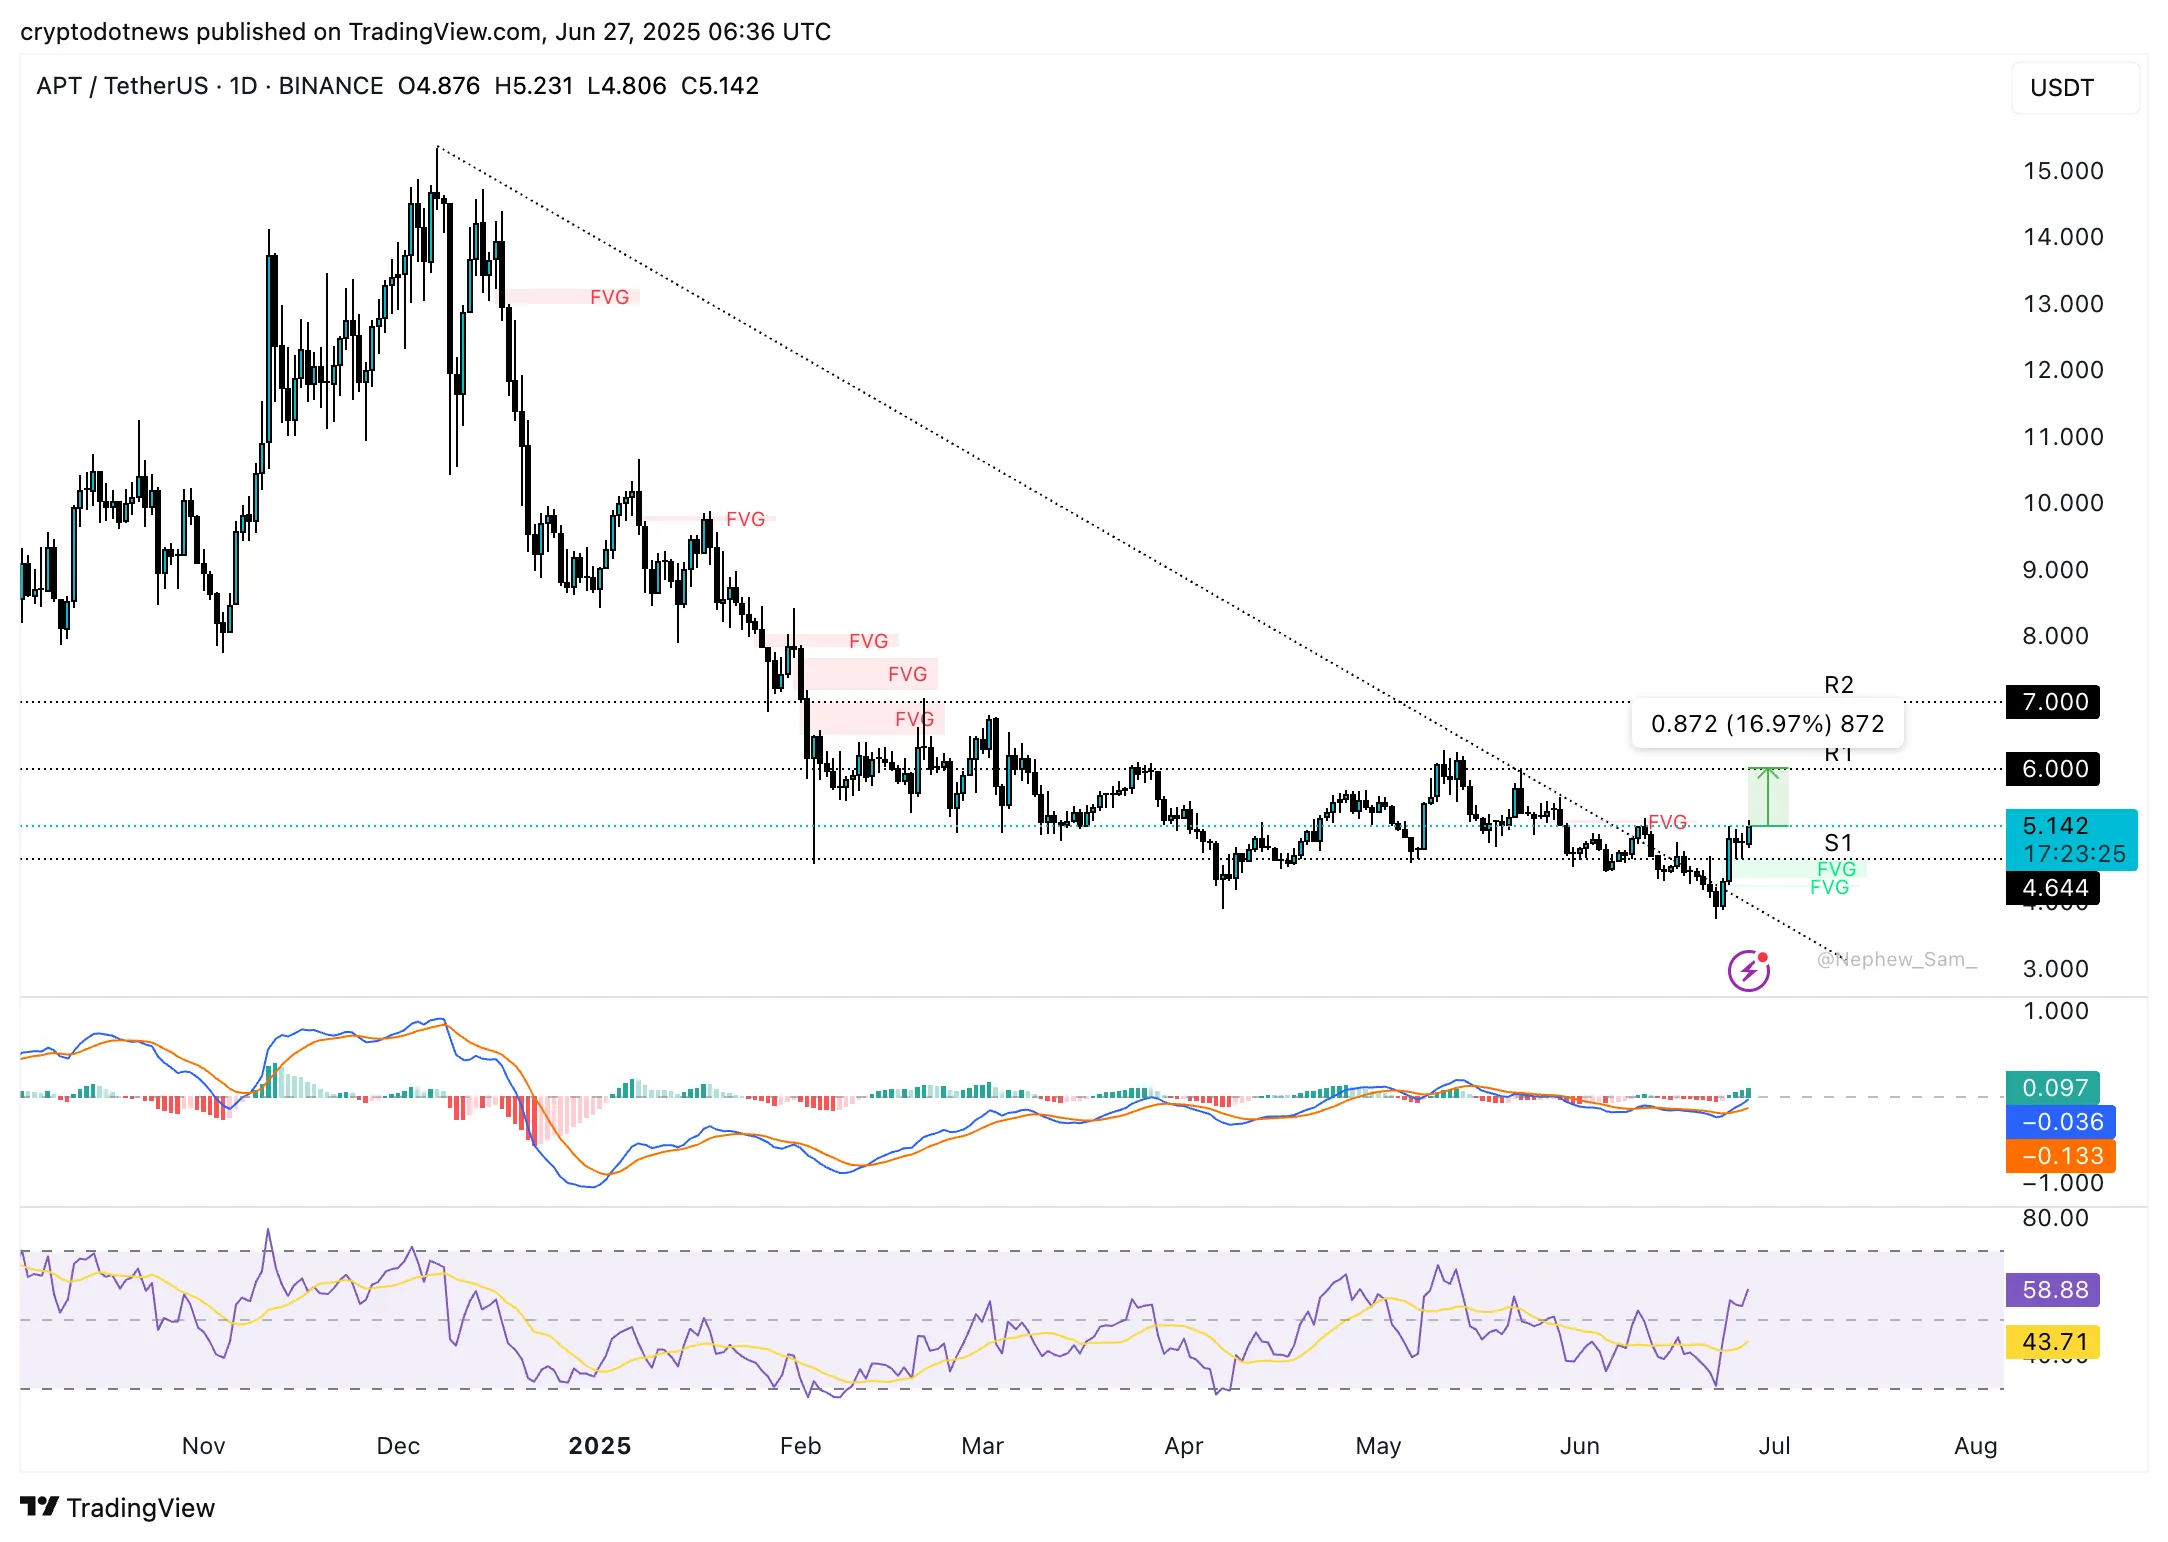
APT/USDT daily price chart | Source: Crypto.news
Disclosure: This article does not represent investment advice. The content and materials featured on this page are for educational purposes only.