






Ethereum price looks ready to tackle the all-time high as a bullish pattern has emerged on the 12-hour chart.
A minor sell-off may occur as the technical pattern has yet to complete its right-shoulder formation.
If the chart pattern is robust, ETH may target $4,610 next.
Ethereum price (ETH) is forming a bullish chart pattern that suggests ETH could rally 25% if the technical pattern is robust. However, the second-largest cryptocurrency by market capitalization could see a minor sell-off before bigger aspirations can be realized.
Ethereum price steadies ahead of new record highEthereum price is gearing up to record a new all-time high as a head-and-shoulders pattern is forming on the 12-hour chart. If the governing technical pattern manages to be completed, ETH could be preparing for a 25% climb toward $4,610.
Investors should note that the optimistic target given by the prevailing chart pattern would only be robust if Ethereum price slices above the neckline at $3,673. A spike in buying pressure must also occur to push ETH higher.
Ethereum price may face various resistances as ETH moves toward the bullish target. The first obstacle is at the 78.6% Fibonacci retracement level at $3,730, then at the September 7 high at $3,947.16.
The following hurdles for Ethereum price will emerge at $4,029, then at 4,131 and at $4,207: the September 3 high, May 15 high and the May 10 high, respectively.
The last hurdle before Ethereum price could create a new record high is at the 127.2% Fibonacci retracement level at $4,403, which sits near the current all-time high.
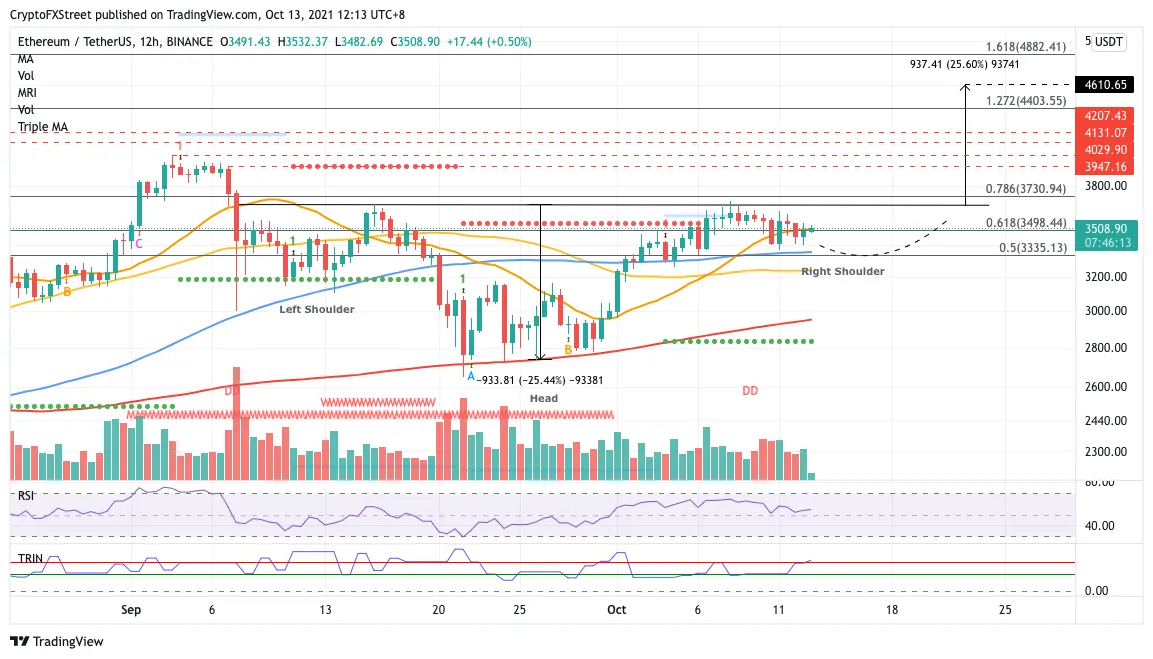
Before Ethereum price enters into its bull run, the head-and-shoulders pattern may continue to form, which means that ETH may see a minor correction. The first line of defense is at the 61.8% Fibonacci retracement level at $3,498, then at the 50% Fibonacci retracement level at $3,335, coinciding with the 100 twelve-hour Simple Moving Average (SMA).
Further selling pressure may see Ethereum price dip toward the 50 twelve-hour SMA at $3,236, then toward the September 13 low at $3,104. An additional foothold may appear at the 200 twelve-hour SMA at $2,949, before dropping toward the support line given by the Momentum Reversal Indicator (MRI) at $2,834.
However, if ETH falls beyond the MRI support, the chart pattern could be voided and bullish aspirations dissipated.