




Bitcoin is sitting in a tight area where both resistance and downside liquidity now matter. While price is pressing into a familiar barrier near the mid $74,000 to $76,000 range, traders are also watching the $73,000 to $73,500 zone below for a possible sweep.
Bitcoin Liquidity Builds Between $73K Support and $76K Resistance
Bitcoin is trading between two key liquidity zones, with downside pressure building just below the current price and resistance forming overhead, according to a Binance $BTC/$USDT liquidation map shared by Daan Crypto Trades on X.
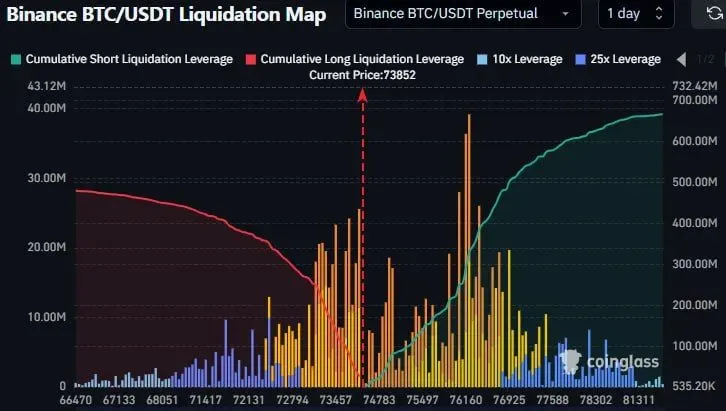
Binance $BTC/$USDT Liquidation Map. Source: Daan Crypto Trades on X
The chart shows large liquidity clusters sitting around $73,000 to $73,500. That area stands out as the nearest downside zone where price could move if Bitcoin starts to sweep lower liquidity. In liquidation terms, those clusters often attract price because they mark areas where leveraged positions may get forced out.
Above the market, the main level to watch is $76,000. Daan Crypto Trades said Bitcoin made an equal high there yesterday, matching the previous local high from March. That makes $76,000 an important resistance area, since price failed to break higher on both attempts.
For now, the setup shows Bitcoin caught between support side liquidity below and equal high resistance above. If $BTC loses momentum, the $73,000 to $73,500 zone could come into focus quickly. However, if buyers push price through $76,000, that could weaken the short term resistance structure and open the way for a move higher.
Bitcoin Returns to January Resistance as Breakout Confirmation Still Lacks
Bitcoin has climbed back to the same resistance zone that capped price in January, according to chart analysis shared by Elja on X. The setup puts focus on whether $BTC can finally break through or face another rejection from a level that previously triggered a sharp decline.
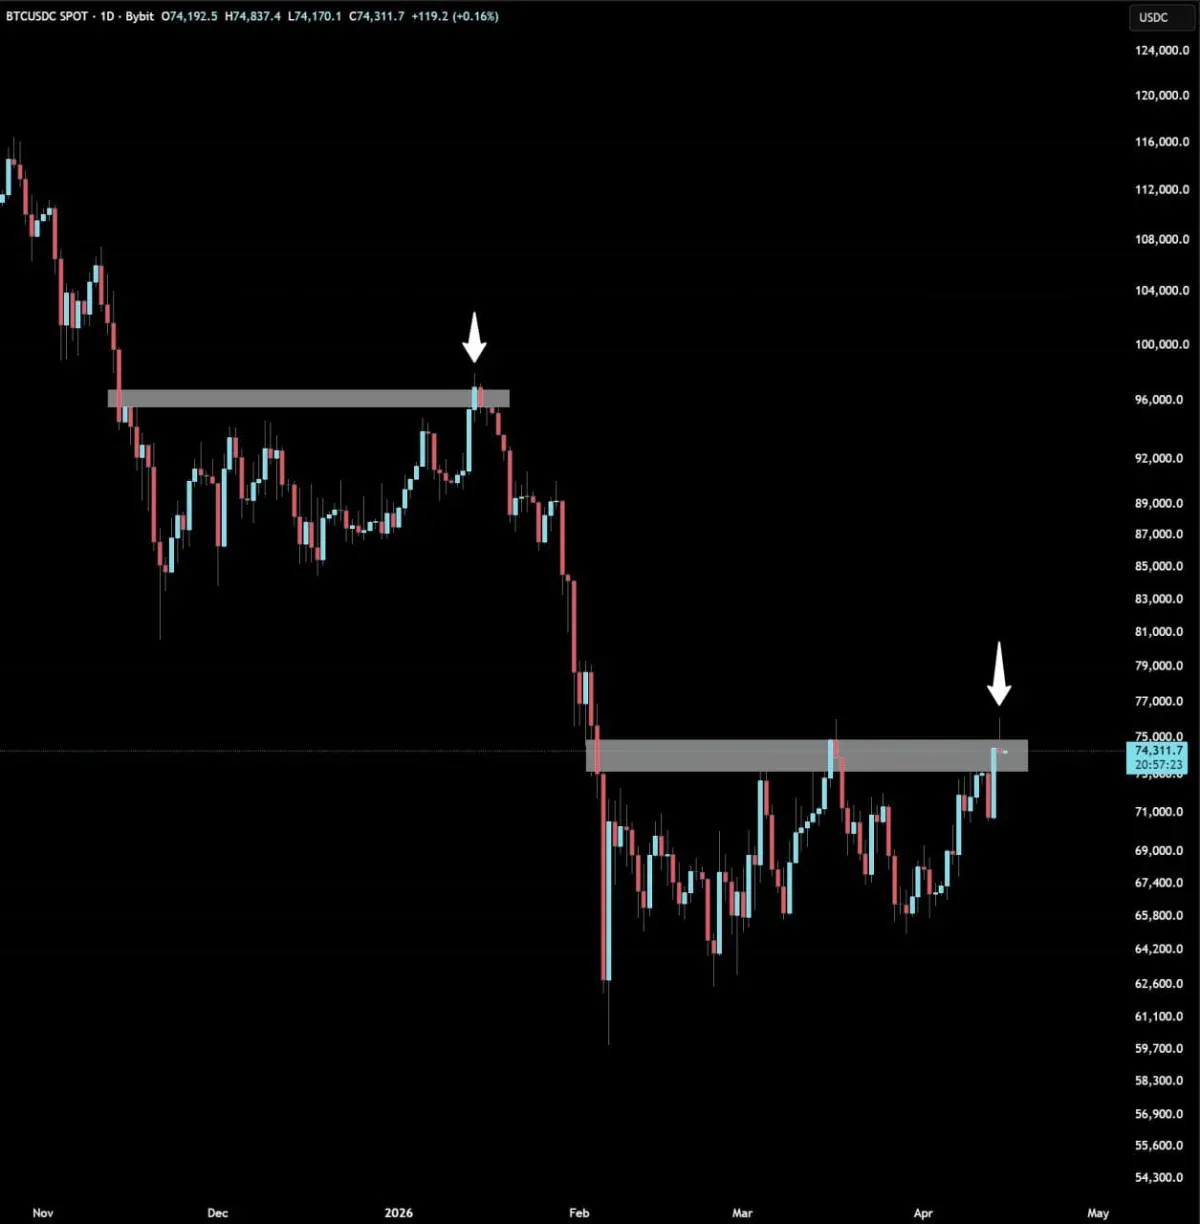
BTCUSDC Spot 1 Day Chart. Source: Elja on X
The daily chart shows Bitcoin trading near $74,311 while testing a gray resistance band around the mid $74,000 area. Elja said this is the same zone where bullish sentiment rose in January before price reversed lower. Because of that, the current retest carries added weight for traders watching whether the market can hold up at a familiar ceiling.
This time, the analyst warned against assuming a breakout before confirmation arrives. The chart suggests Bitcoin has returned to resistance, but it has not yet cleared that level in a convincing way. Until that happens, the move remains vulnerable to another rollover similar to the one seen earlier in the year.
For now, the key issue is whether $BTC can close above the resistance band and turn it into support. If that happens, the market structure would look stronger and could support further upside. However, if price fails again at this zone, the chart suggests many late buyers could get caught on the wrong side of the move.