




Dogecoin is giving mixed signals as short-term weakness points to lower levels, while the weekly chart shows $DOGE back in a historic accumulation zone.
Carlos Garcia Tapia says $DOGE shows little strength near current levels, but Hailey $LUNC $XRP says the same range could become a base for a larger breakout if past cycles repeat.
Dogecoin Shows “Zero Strength” as Bears Eye Lower Levels
Dogecoin remains under pressure after failing to build momentum from its recent bounce, with price continuing to trade below key resistance levels. One analyst believes the current structure points to further downside unless buyers can reclaim lost support and reverse the short-term trend.
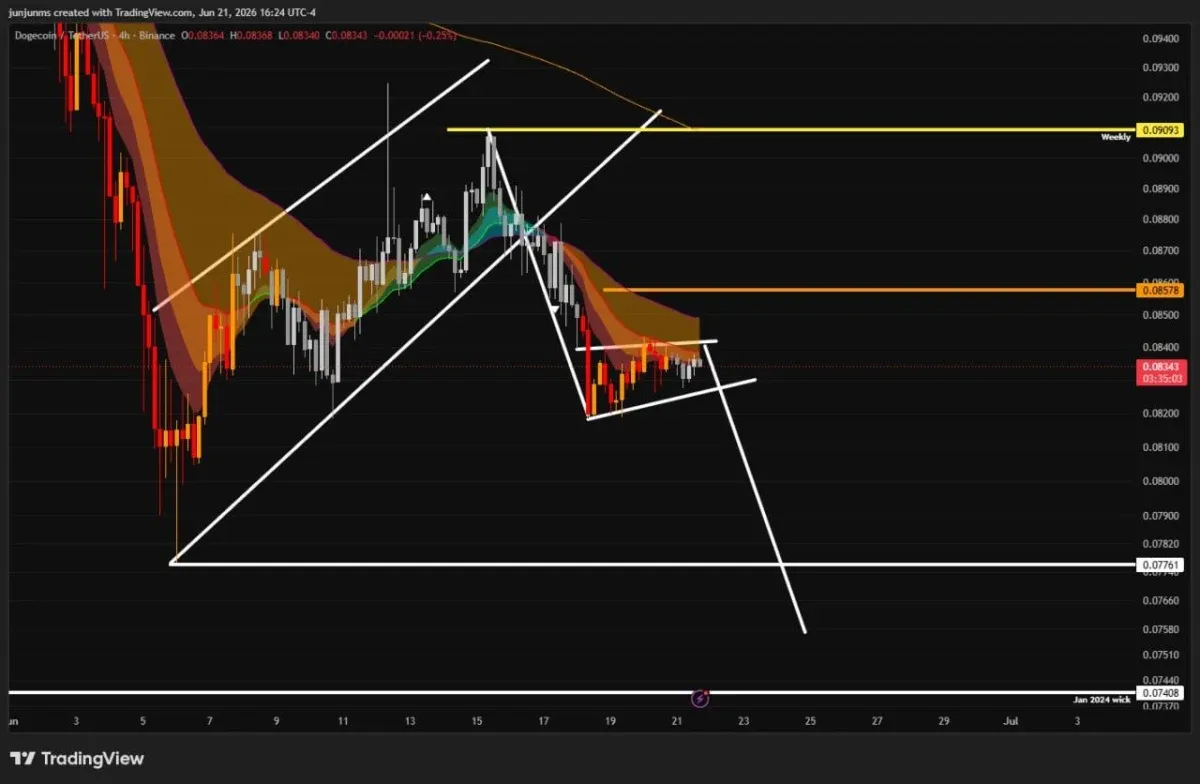
The four-hour chart shared by Carlos Garcia Tapia shows $DOGE trading around $0.083 while struggling beneath a descending trend structure. The analyst described Dogecoin's current condition as showing “absolute zero strength,” pointing to weak bullish follow-through and repeated failures near resistance.
The chart highlights a small rising wedge developing after a sharp decline, a pattern that often breaks to the downside when momentum remains weak. $DOGE also remains below resistance levels near $0.0858 and $0.0909, limiting the chances of a sustained recovery in the near term.
According to the analysis, a breakdown from the current structure could open the door for a move toward support around $0.0776. However, a reclaim of overhead resistance would weaken the bearish outlook and suggest buyers are regaining control.
For now, traders are watching whether Dogecoin can defend its current support zone or if continued weakness triggers another leg lower.
Dogecoin Returns to Historic Accumulation Zone as Analyst Eyes Major Breakout
Dogecoin has moved back into a price zone that previously served as a launchpad for explosive rallies, raising speculation that another cycle move could be developing. One analyst believes the current setup closely resembles past accumulation phases that preceded $DOGE's strongest advances.
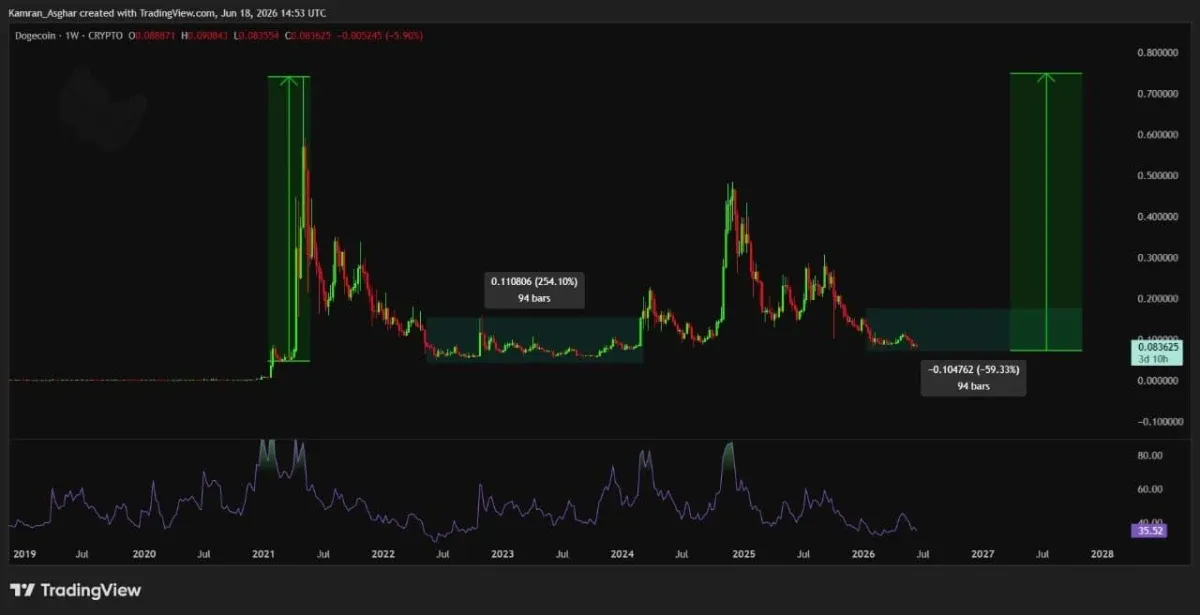
The weekly chart shows Dogecoin trading near $0.084 after a prolonged decline from its recent highs. According to Hailey $LUNC $XRP, the meme coin has returned to a historical accumulation range where price spent months consolidating before major breakouts in previous market cycles.
The chart compares the current structure with earlier $DOGE cycles and highlights a similar period of extended sideways movement following a steep correction. Previous accumulation phases were followed by rallies of more than 250%, leading the analyst to suggest that a comparable move could emerge if history repeats.
The Relative Strength Index also remains near historically low levels, indicating that market momentum is far weaker than during prior bullish phases. Supporters of the bullish outlook view this as evidence that $DOGE may still be in the early stages of a longer-term accumulation process.
For now, traders are watching whether Dogecoin can continue holding this zone and build momentum. A breakout from the current range could strengthen the bullish case, while a loss of support would delay expectations for a larger recovery.