The bears are now gaining back control in todays session, as seen from the decrease in the global market cap. The total cap stood at $2.04T as of press time, representing a 0.15% decrease over the last 24 hours, while the trading volume jumped by 10% over the same period to stand at $61.54B as of press time.
Bitcoin, $BTC, has failed to post gains in todays session, as seen from its price movements. Looking in-depth analysis, we see that the 50, 100, and 200 SMAs (simple moving averages) show a confluence around the price, which indicates indecision in market direction. The Bitcoin price is currently near the 100 and 200 SMAs, signaling a key resistance point at $58,947.
The Relative Strength Index (RSI) is hovering near neutral levels, reflecting a balanced sentiment with neither overbought nor oversold conditions. However, if the price breaks above the 200-SMA, it could indicate a bullish continuation. Bitcoin traded at $58,498 as of press time, representing a 0.57% decrease over the last 24 hours.
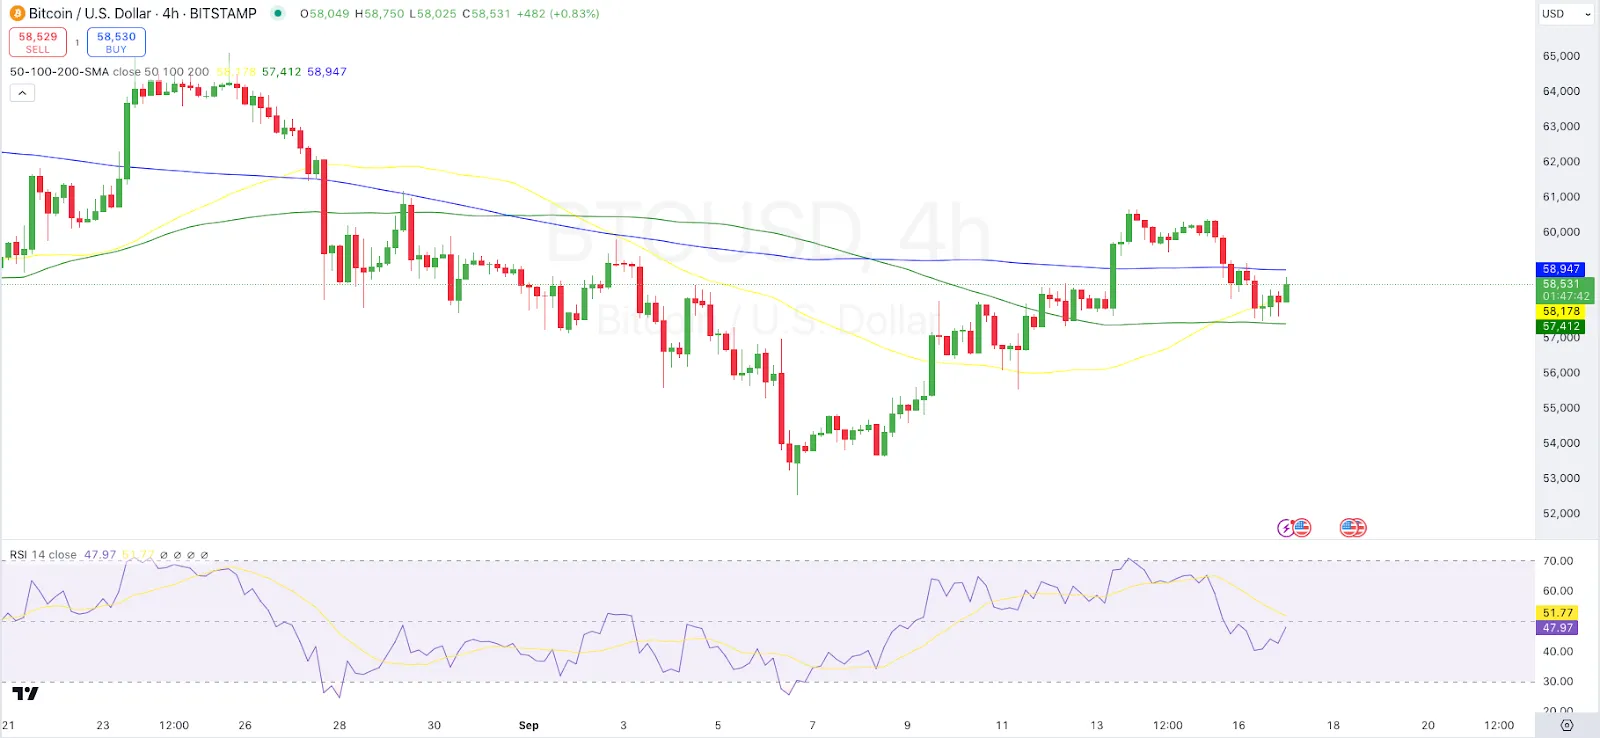
4-hour BTC/USD Chart | Source: TradingView
Ethereum Price Review
Ethereum, $ETH, is among the gainers in today‘s session as seen from its price movements. Looking at an in-depth analysis, we see that Ethereum’s 4-hour chart presents a consolidation within a cloud formation as represented by the Ichimoku Cloud. The Ethereum price is hovering near $2,298, within a weak trendless zone, suggesting a lack of clear directional bias.
On the other hand, we see that the RSI is around 29.32, indicating oversold conditions, which could imply a potential upward reversal if buying pressure builds. Ethereum traded at $2,302 as of press time, representing a 0.30% increase over the last 24 hours.
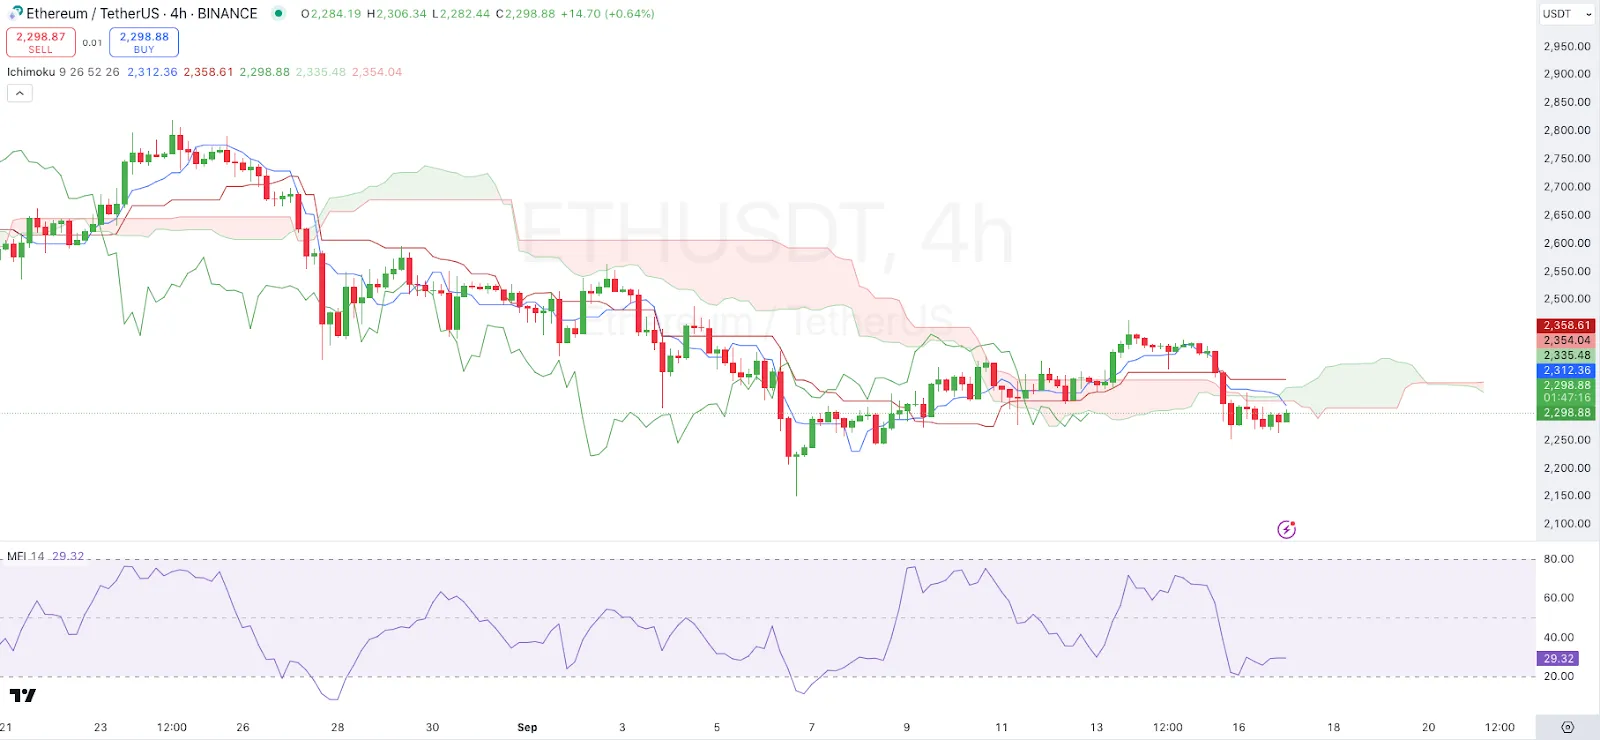
4-hour ETH/USD Chart | Source: TradingView
Fantom Price Review
Fantom, $FTM, is also among the gainers in today‘s session as seen from its price movements. Looking at an in-depth analysis, we see that Fantom’s price has been moving with strong bullish momentum, reflected by the wide separation in the Bollinger Bands and a recent price surge above the upper band.
The Fantom Price is currently near $0.5481, and the ADX reading of 26.61 indicates a strengthening trend. If the price holds above the upper Bollinger Band, it may continue its upward trajectory. Fantom traded at $0.55 as of press time, representing a 11.63% increase over the last 24 hours.
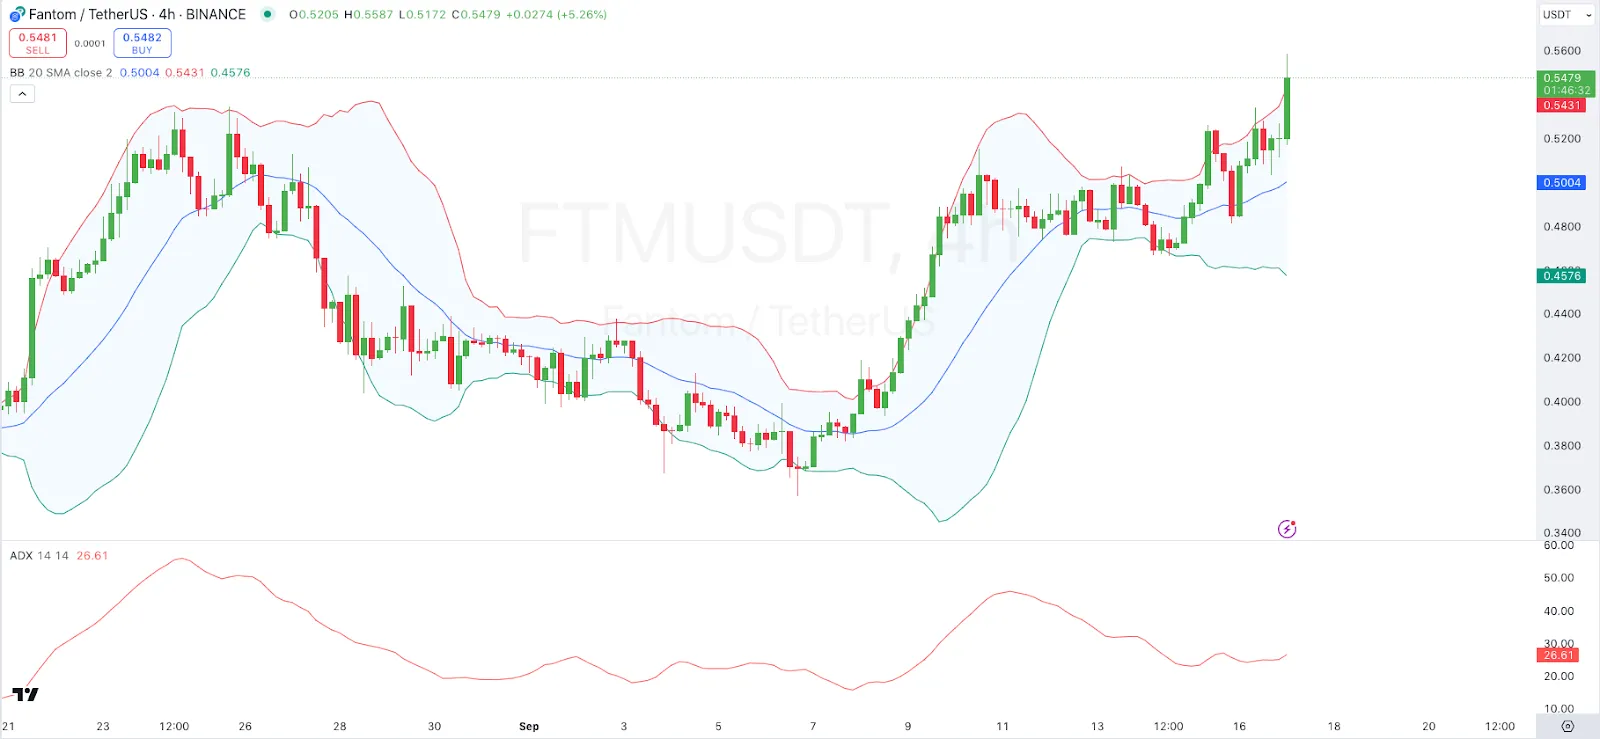
4-hour FTM/USDT Chart | Source: TradingView
Celestia Price Review
Celestia, $TIA, is also among the gainers in todays session as seen from its price movements. Looking at an in-depth analysis, we see that Celestia is currently showing an upward recovery after a prolonged downtrend. The Alligator indicator has the moving averages curling upward, suggesting the formation of a bullish trend. The Celestia price is near $5.005, and the next resistance is around $5.10, which could act as a barrier.
On the other hand, we see that the Volume Oscillator is showing a decreasing trend, signaling a potential lack of strong momentum in the current move. Celestia traded at $4.99 as of press time, representing a 5.59% increase over the last 24 hours.
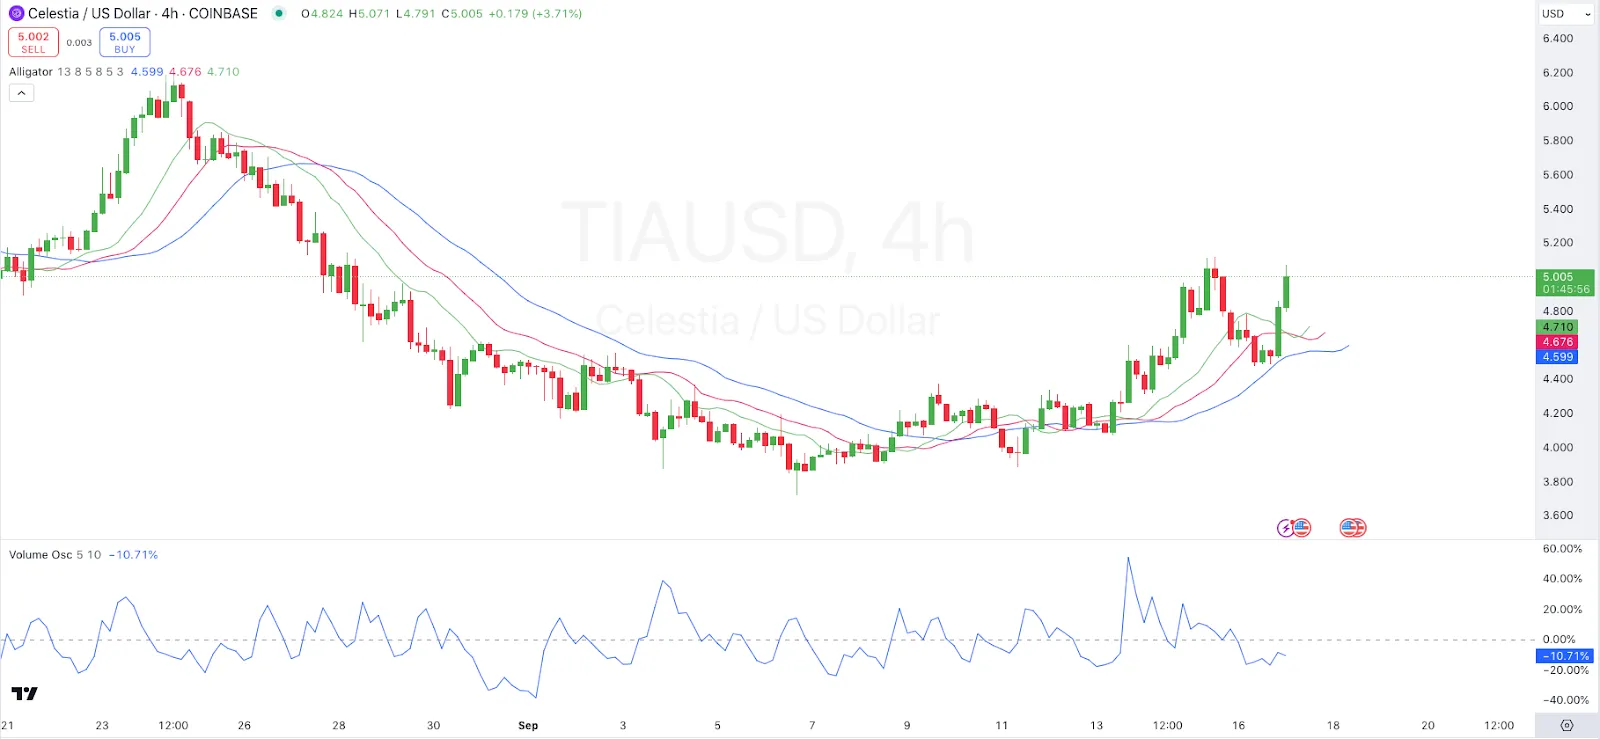
4-hour TIA/USD Chart | Source: TradingView
THORChain Price Review
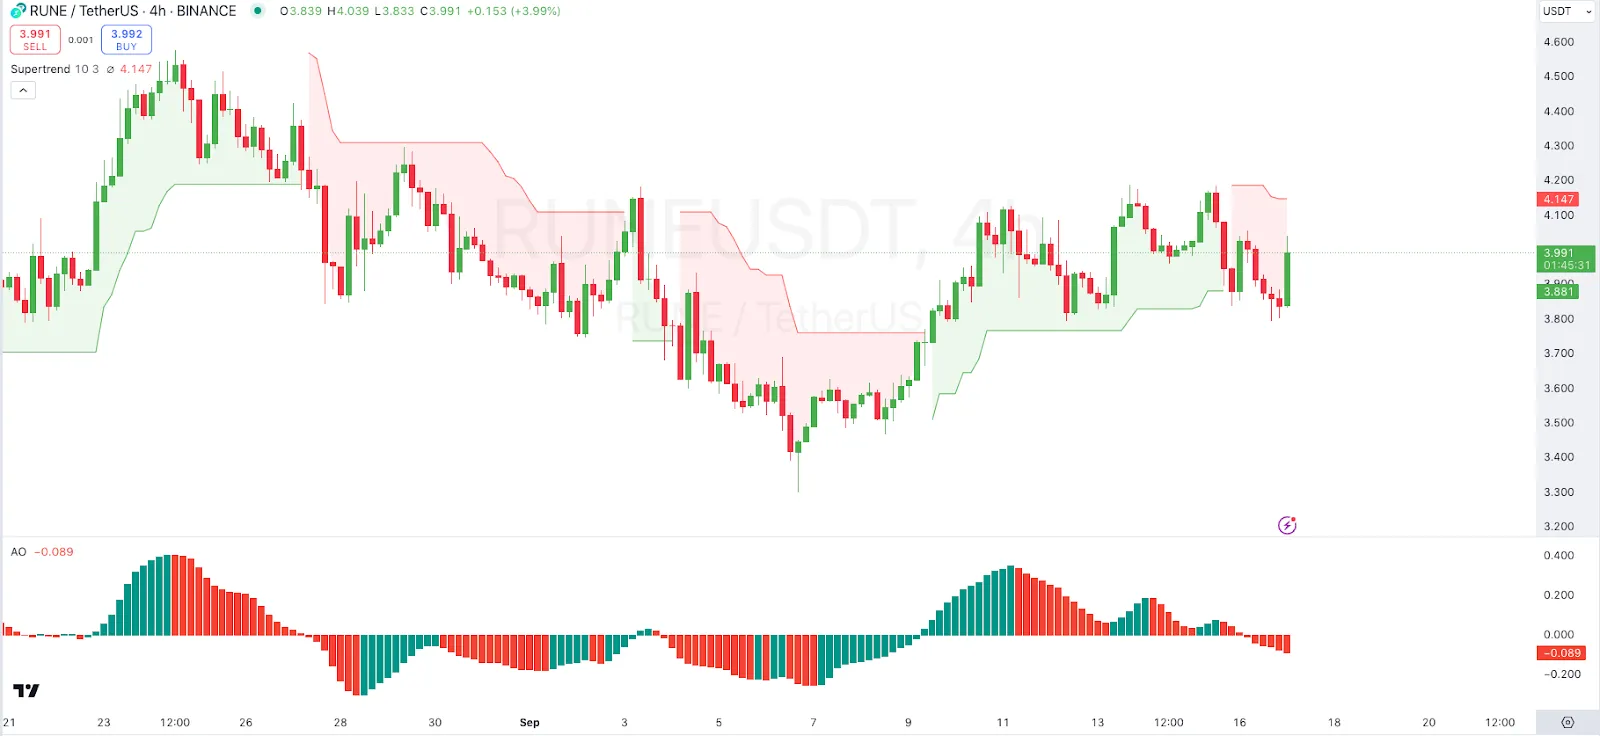
THORChain, $RUNE, is also among the gainers in todays session as seen from its price movements. Looking at an in-depth analysis, we see that the Supertrend is indicating bearish conditions as the price is below the green-to-red conversion point.
Currently at $3.991, the Awesome Oscillator (AO) is showing weak bullish momentum with a small histogram of green bars. THORChain traded at $4.00 as of press time, representing a 5.52% increase over the last 24 hours.