




Since the start of the year, Litecoin‘s price has fallen by almost a third of its January open, tumbling massively and briefly trading around $45 in early February. The prolonged pullback has kept sentiment quiet, but Litecoin’s price is now back to stabilizing around $53.
A recent technical analysis shared on X by crypto analyst Jonathan Carter shows that a triangle support defense is currently playing out for Litecoin. Technical analysis of Litecoins price chart shows a descending triangle that has been developing for several years on the weekly timeframe. Right now, Litecoin is trading close to the triangle support, and the reaction at this support will determine whether Litecoin could launch to $285.
Descending Triangle Support Faces Major Test
The weekly chart shows Litecoin locked inside a large descending triangle structure, with a downward-sloping resistance trendline that has rejected rallies since its 2021 peak at $410. Each subsequent rally has printed lower highs, and this has led to a long-term compression pattern.
Now, the price is sitting near the lower border of the formation, around $55-$45. This area is important because it has always attracted buyers, and Litecoin has never traded below this level since August 2020.
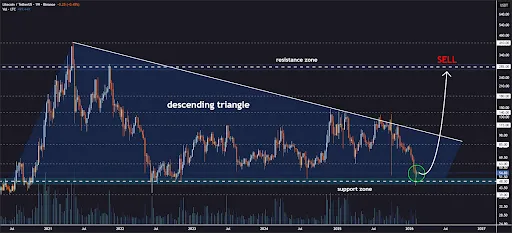
Carter noted that Litecoin is attempting to bounce from this lower border, with bulls stepping in as trading volume begins to increase.If this level continues to hold, it would strengthen the case that there is a return to bullish momentum.
The Five Major Levels On The Path Higher
The bullish outlook is that Litecoin is about to keep trending upwards after recently bouncing on the support. The most recent weekly candlesticks have been a reversal in nature, with a doji candlestick with last week‘s candle, which is a reversal candlestick. That formation came after five consecutive weekly red closes, and this makes last week’s candle particularly notable, as it hints at potential exhaustion from sellers and the early stages of a trend change.
If Litecoin sustains a bounce from the triangles base, then there is a sequence of important resistance levels that could shape the recovery. Carter noted various upside checkpoints in between and $285 as the ultimate price target.
The first checkpoint sits around $63, a price level that acted as a pivot area throughout 2025. Clearing this level on a weekly basis would likely change the short-term momentum in favor of buyers. Above that, there is another resistance around $85 that could slow the advance.
The next mid-range targets are $115 and the 2025 swing high around $140. A move through these levels would point to a bullish structure where Litecoin returns to price levels not seen since the 2021/2022 cycle. In this case, the price targets are around $180, and the final and most ambitious level on the chart is $285. However, this is still below the long-standing Litecoin all-time high of $410 in May 2021.
Featured Image from iStock, chart from Tradingview.com