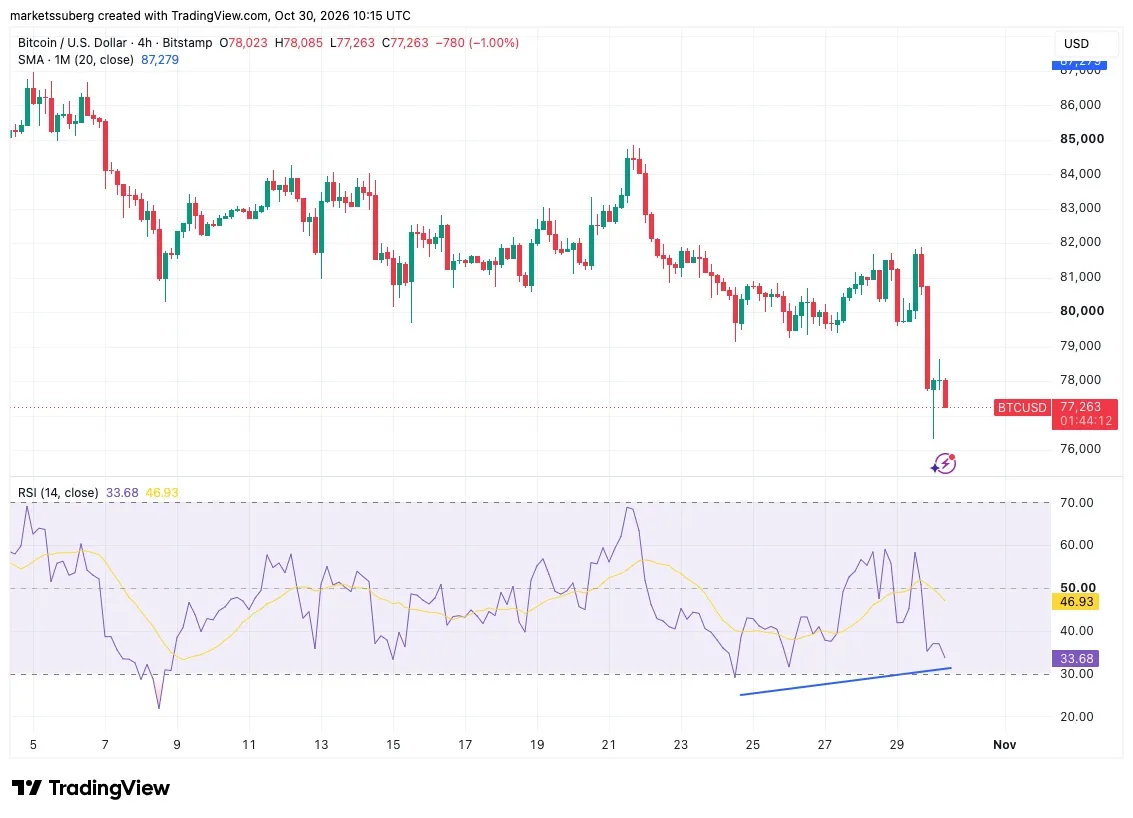

Bitcoin (BTC) traded above $77,000 on Friday as crypto market liquidations passed $1.5 billion over 24 hours.
Key points:
- Bitcoin stemmed losses after dropping to $76,320 as markets processed details of a $6.3 billion hack on Binance.
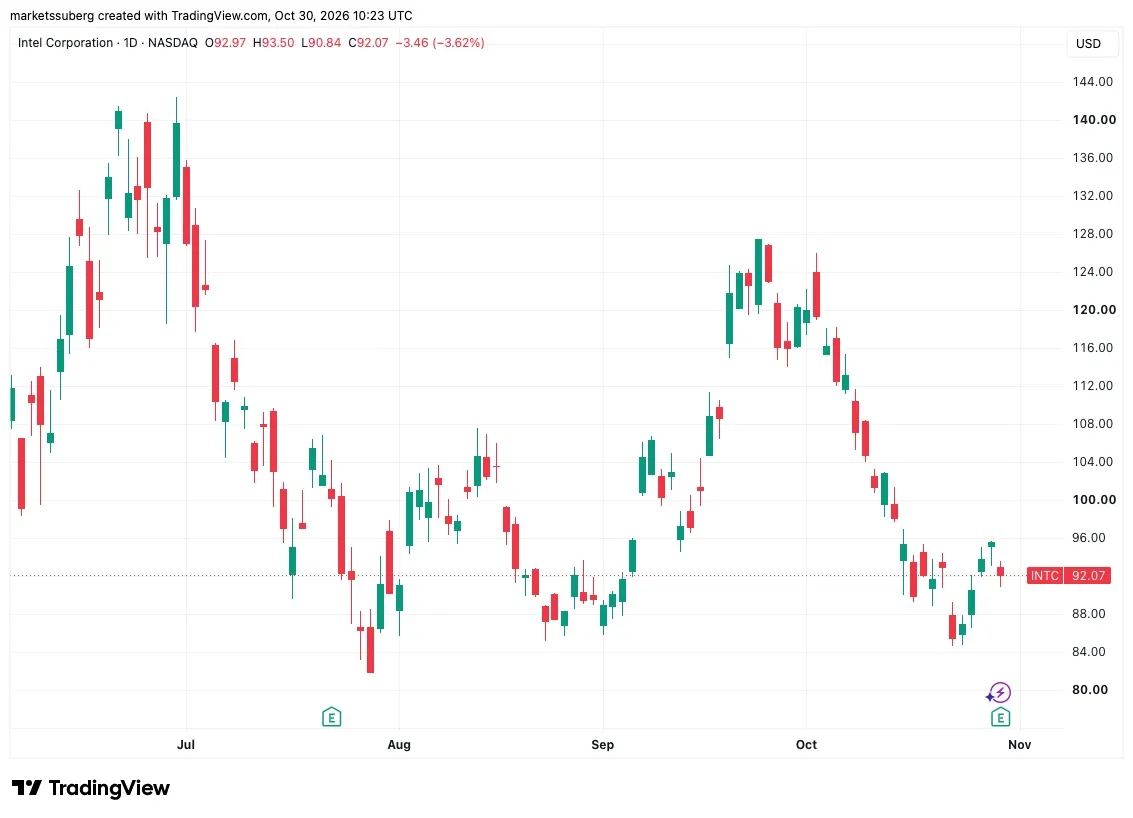
- The effects of the hack on crypto markets were compounded by tech-stock losses that came with Q4 earnings projections. Intel Corporation (INTC) was down 26% premarket on Friday.
- Bitcoins relative strength index prints a bullish divergence on four-hour timeframes as sell-side pressure waned below $77,000.
US tech-stock sell-off adds to crypto jitters after Binance hack
Data from TradingView showed BTC/USD dropping as low as $76,320 amid the fallout from a $6.3 billion hack of the largest cryptocurrency exchange Binance.
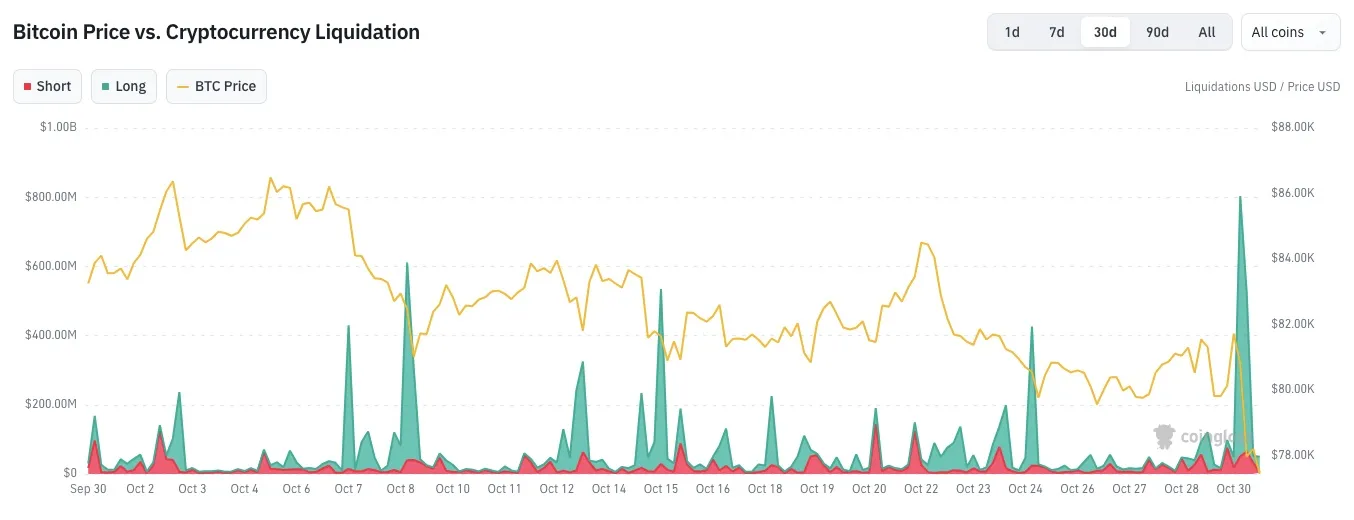
Rolling 24-hour liquidations of traders across the industry reached $1.56 billion. Long positions accounted for the majority of this figure at $1.31 billion, per CoinGlass data.
In its latest update on X, Binance described the attack as “complex,” reporting more than a single security breach during the episode.
“We are still gathering the facts, and will share more directly as we have them,” it wrote.
Downside momentum cooled after the company confirmed that all user losses would be covered from its dedicated SAFU fund and other company resources.
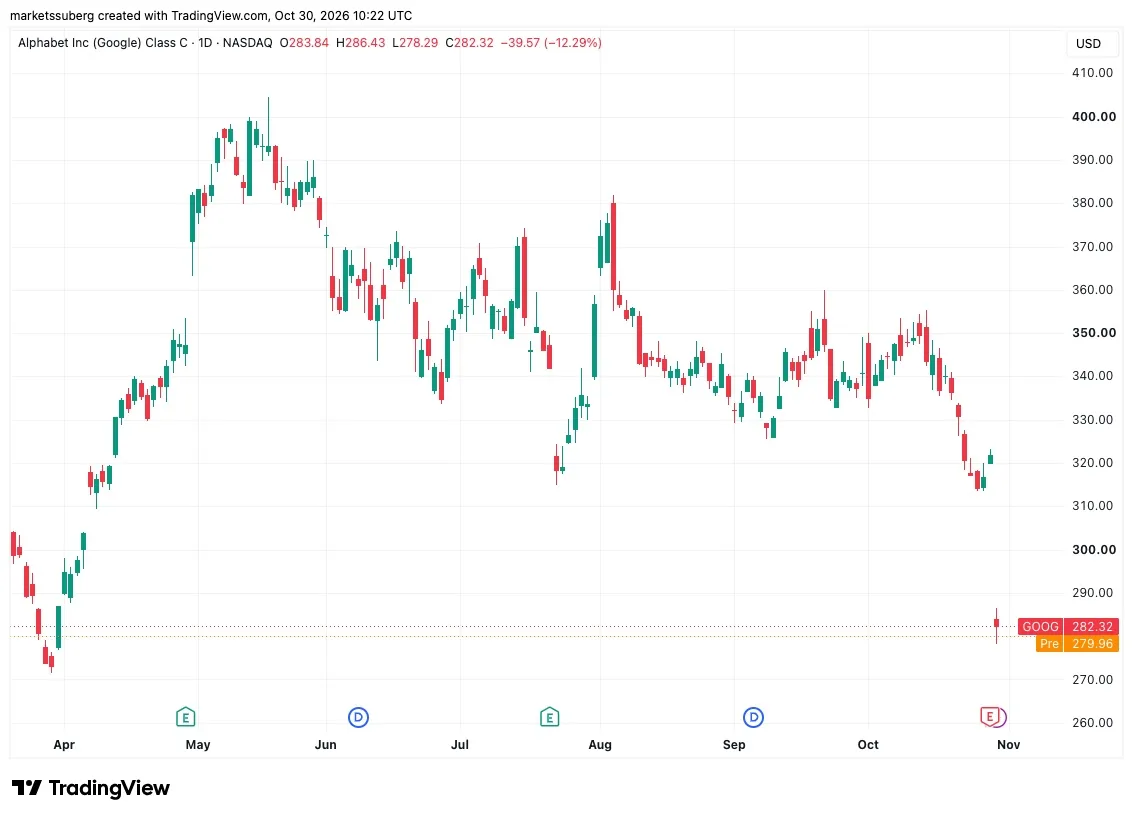
The hack added to macro pressure on crypto, with US stock markets falling on Thursday after tech earnings fell short of expectations. Alphabet missed earnings and revenue targets on Wednesday. In the aftermath, GOOGL fell by 13% to $282, its lowest level since April.
Intel shares plunged 26% premarket on Friday as the company issued a weaker-than-expected outlook, even though Q3 revenue and earnings beat estimates. Intel said it expects Q4 sales of $15 billion to $16 billion, versus analysts projected $17 billion to $18 billion.
BTC price bullish divergence emerges at local lows
On lower timeframes, BTC price metrics returned to levels not seen since BTC/USD hit multiyear lows near $57,000 in late June.
Related: Strategy eyes more Bitcoin buys as Saylor touts $30B credit capacity
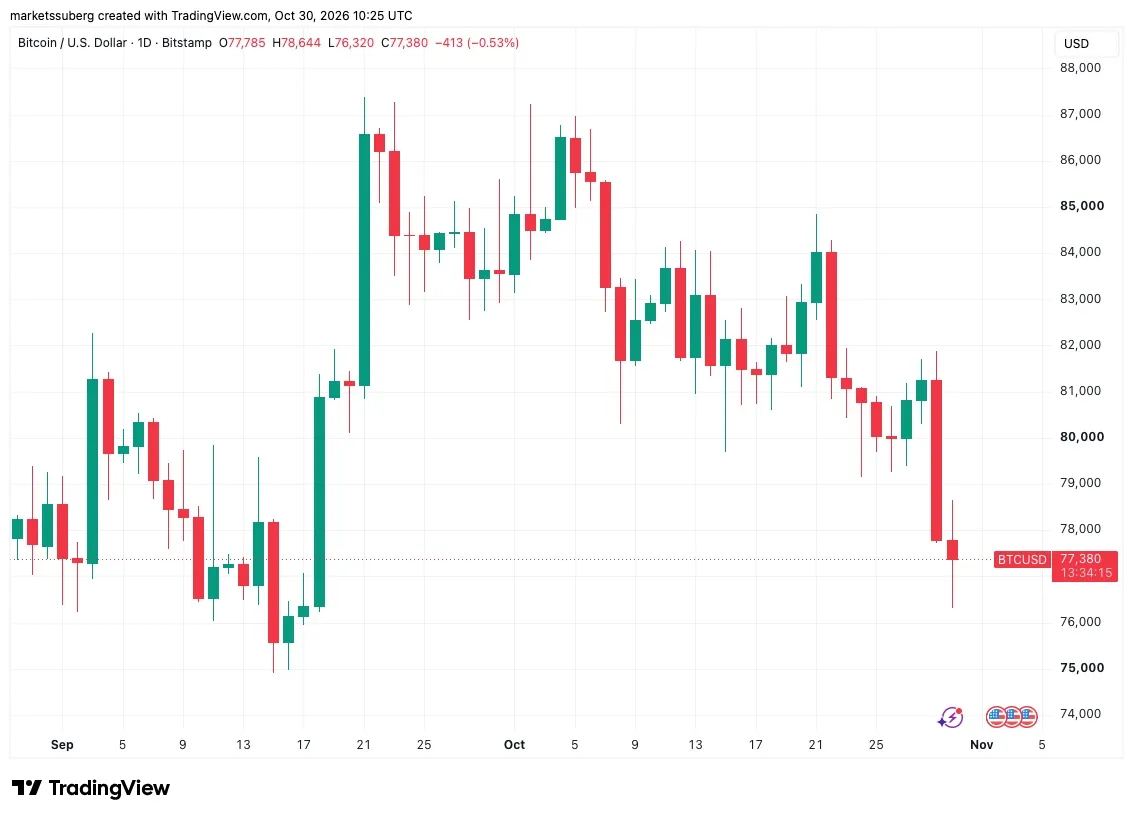
On Thursday, price closed below the lower band of the Bollinger Bands volatility indicator, a phenomenon last observed on June 25. Such a move reflects that price is trading more than two standard deviations below its 20-day simple moving average (SMA). While Bollinger Bands do not produce buy and sell signals, a close below the lower band can imply that a mean reversion is due. The 20-day SMA currently sits at $81,324.
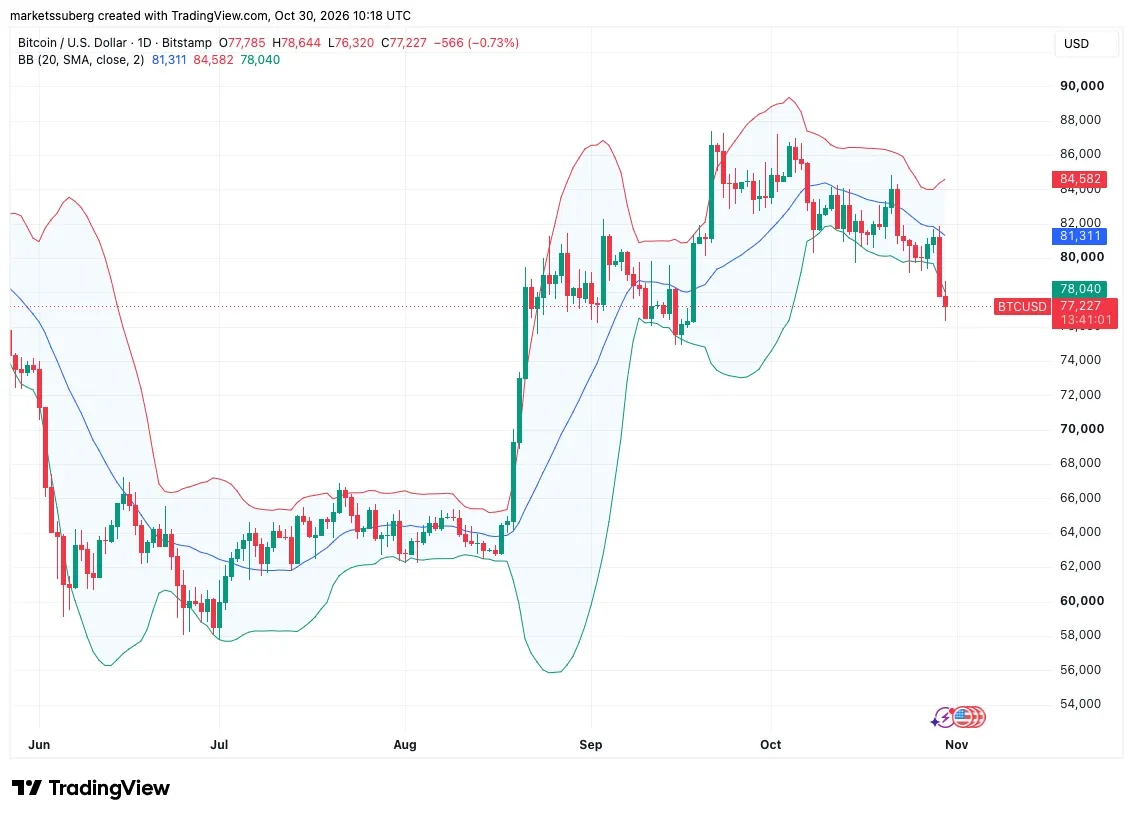
BTC/USD one-day chart with Bollinger Bands data. Source: Cointelegraph/TradingView
The relative strength index (RSI), a popular leading indicator for price momentum, dropped to 34.7 on its 100-point scale on Friday. This is its lowest reading since June 30 and approaching its “oversold” zone below 30.
On the four-hour timeframe, RSI displayed a bullish divergence from the Bitcoin price, delivering a higher swing low compared to a lower low on BTC/USD. Such divergences can signal weakening seller control and a possible local trend change.