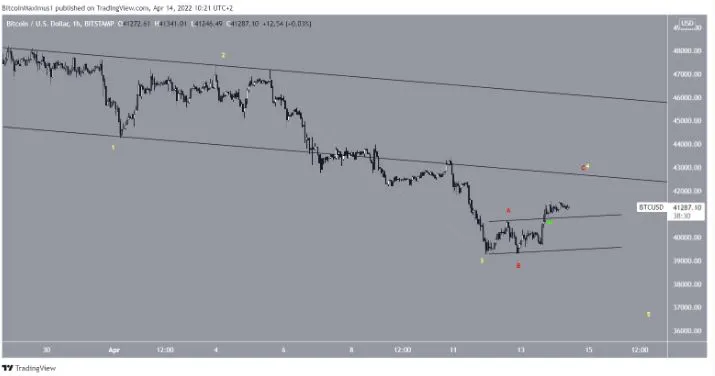
Bitcoin has been falling since reaching a high of $48,189 on March 28 and reached a local low of $39,200 on April 11.
The price rebounded the following day and managed to briefly touch $41,561.
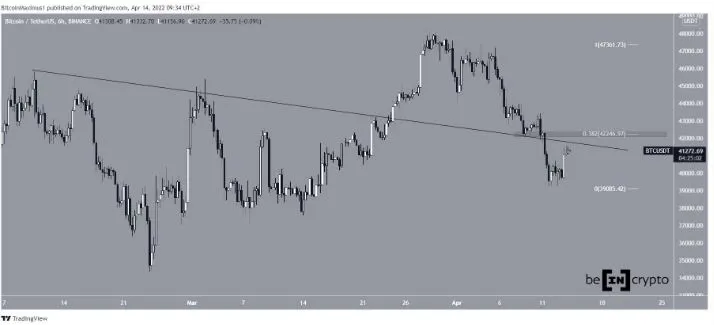
The main resistance area is found at $42,250. This target is a horizontal resistance area and the 0.382 Fib retracement resistance level. It also coincides with a descending resistance line that had previously been in place since February.
BTC initially broke out above this descending resistance on March 21, but failed to validate it as support and broke down below it on April 6. The line is now expected to act as resistance again.
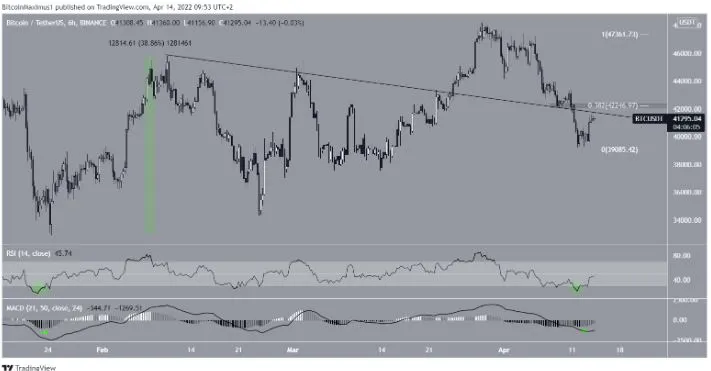
Technical indicators in the six-hour chart show extremely oversold conditions in both the RSI and MACD.
The RSI has not been this oversold since Jan. 24 (green circle).
Similarly, the MACD is deep into negative territory and has given a bullish reversal signal (green icon).
The previous time both these signals occurred, BTC initiated an upward move with a magnitude of 40%.
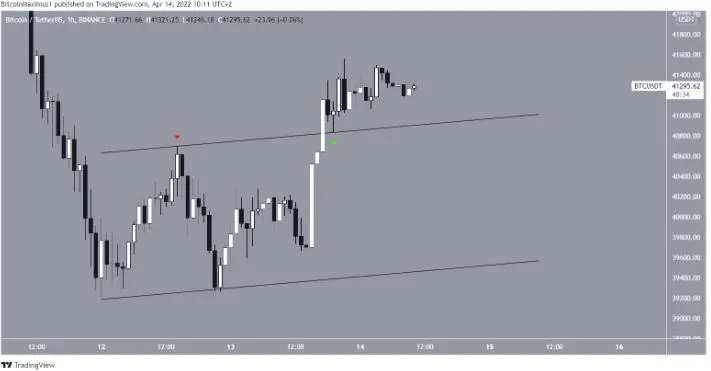
The two-hour chart shows that BTC has already broken out from a short-term ascending parallel channel and validated it as support after (green icon).
This is considered a sign of bullish trends and could lead to an extended upward move.
However, its imperative that BTC first clears the $42,250 area in order for the trend to be considered bullish.
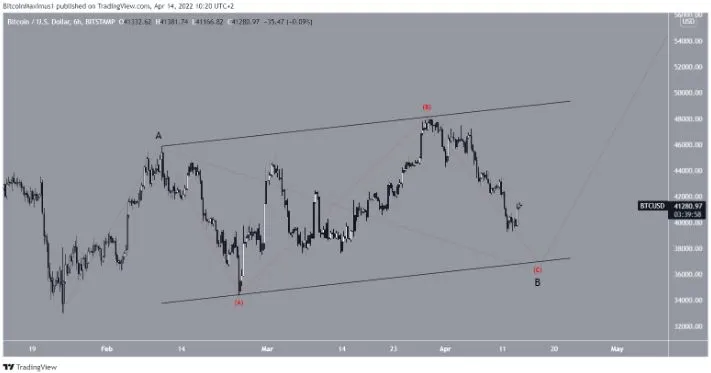
The long-term wave count suggests that an eventual upward move toward $50,000 is expected. However, BTC could still make another short-term low prior to doing so.
If the ongoing downward move continues (red), BTC could reach a low near $38,000. This would validate the support line of an ascending parallel channel, and in turn, complete the longer-term correction (black).
The short-term count suggests that BTC could complete sub-wave four (yellow) at the previously outlined resistance area of $42,250 before the final downward move occurs.
Therefore, a bottom seems to be close.