






A rare technical setup has formed on Shiba Inu's (SHIB) weekly chart, potentially triggering the process of removing another zero from the asset's price. The market has recorded a classic “bullish combo,” where long-term seller exhaustion has coincided with a local price reversal.
Right now, the token is trading near its local bottom at $0.00000547, showing a weekly gain of 6.72%. The intrigue of the current situation lies in the technical divergence between the price and the actual indicator readings.
The main argument in favor of a reversal is the formation of a classic bullish RSI divergence. While SHIB's price has been consistently setting new lows over the past several months, the Relative Strength Index has shown a series of higher lows on the weekly timeframe.
This signal has provided a clear indication that selling pressure has been exhausted and the bearish trend is running out of steam.
Shiba Inu chart stalls near local bottom but prepares to erase a zero: A concise breakdown of the situation
As a result, two key drivers have emerged on the chart:
- RSI divergence: Higher lows on the oscillator confirm a hidden influx of liquidity into the asset.
- Support at the bottom: The current green impulse has allowed the price to hold critical lows.
Buyers have managed to establish a local support level and halt aggressive bearish pressure. This price stabilization reduces the likelihood of a further decline in the short term.
The chart clearly demonstrates how the asset is attempting to establish short-term moving averages as local support. Such a divergence between the indicator and the price often precedes impulsive breakouts from prolonged downtrends.
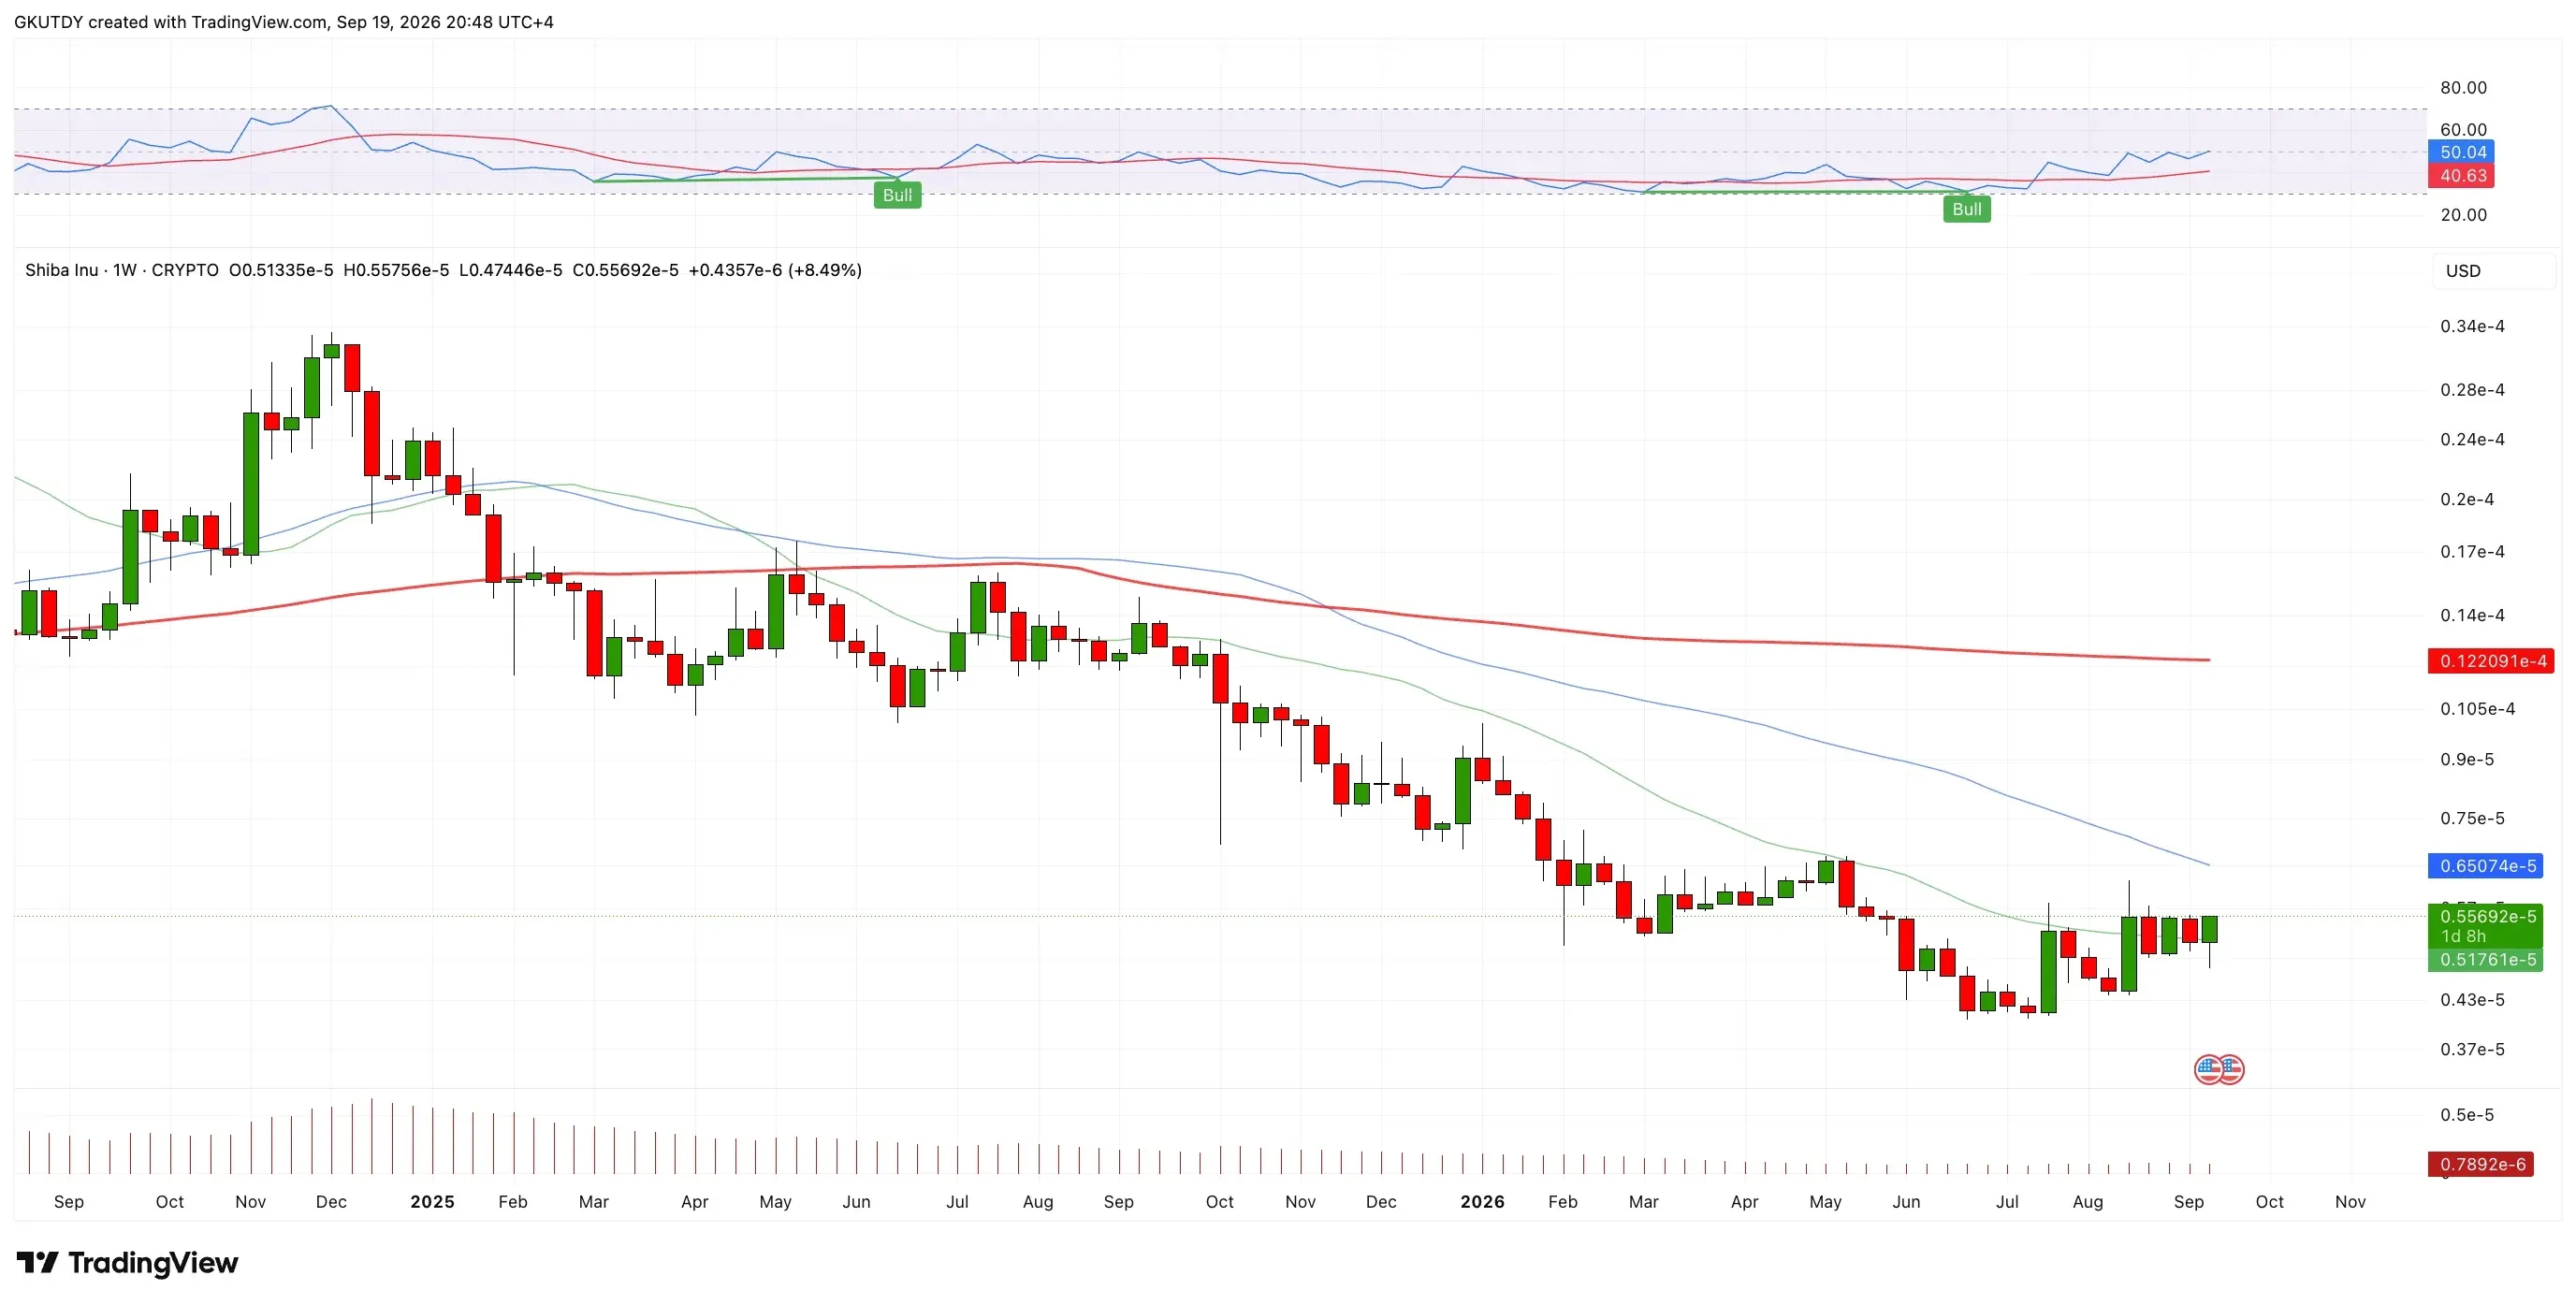
Shiba Inu weekly chart showing a bullish RSI divergence and key moving average resistances, Source: TradingView
However, investors should not expect an easy “removal of a zero” and a stable transition into the $0.00001+ zone. The main barrier for buyers lies significantly above current prices, at $0.0000122. This is where the major 200-week moving average (MA) sits, acting as the primary resistance level on the broader chart.
A breakout above this line is necessary for the technical combo to turn into a full-fledged uptrend. For now, this level continues to exert strong psychological pressure on the market. Previous attempts to break through similar major moving averages have often resulted in deep corrections.
The asset's future directly depends on whether buyers have enough momentum to push through this line. If the market confirms a breakout, SHIB will validate the bullish combo and erase a zero from its price. Otherwise, the current surge will remain nothing more than a temporary rebound.