






Bitcoin momentum turned positive on two widely watched indicators this week, ending a bearish stretch of roughly 10 months. PlanB, creator of the stock-to-flow model, shared the flip and questioned whether reading it could be that simple.
His doubt has a basis. BTC trades near $81,679, down 1.7% over 24 hours and below the $83,094 level shown on his chart.
Sponsored

Sponsored
Do Bitcoin Bull Signals Mark a New Cycle?
PlanB shared a chart from analytics platform Block Horizon tracking momentum in Bitcoins Market Value to Realized Value (MVRV) ratio. MVRV compares market capitalization with the aggregate cost basis of all coins.
Historically, green readings have lined up with bull markets and red readings with bear phases. The oscillator turned green on October 13 at +0.07, after a red run that began in late 2025.
Notably, the 2026 bear phase bottomed near -0.4. That is shallower than the roughly -0.55 troughs of 2018 and 2022.
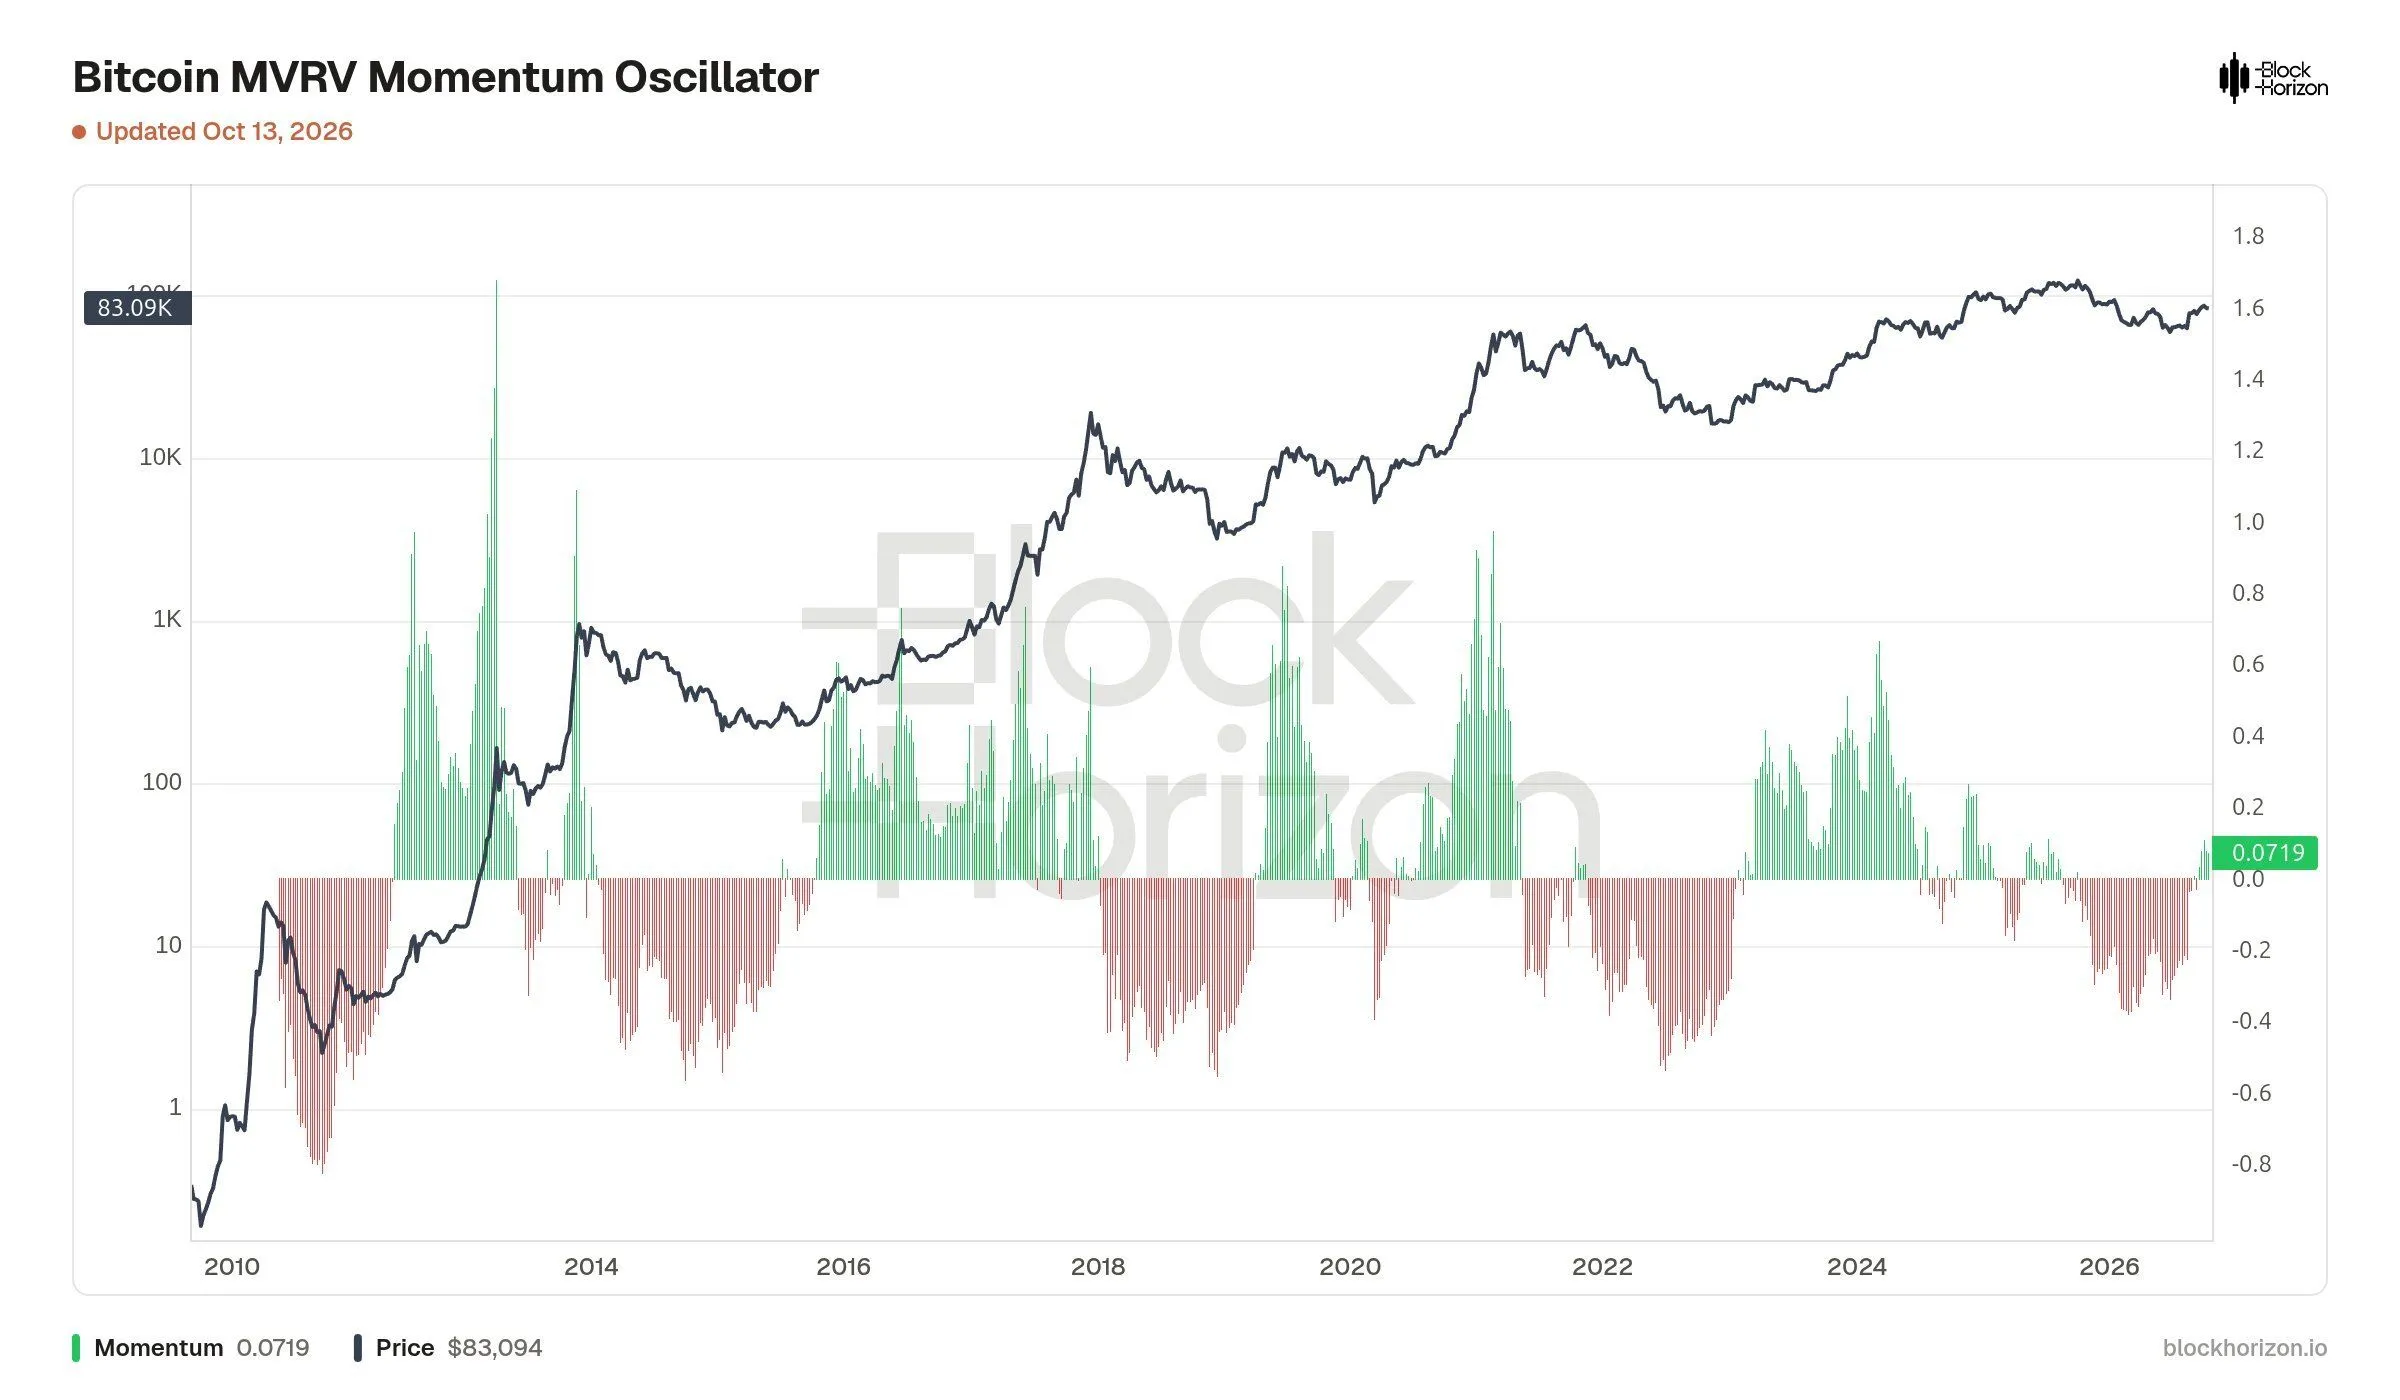
Bitcoin bull signals on the MVRV Momentum Oscillator. Source: X
Sponsored
Sponsored
Why a Positive Flip May Not Confirm the Bottom
Analyst Quinten Francois replied with a second gauge. Bitcoins weekly moving average convergence divergence (MACD) rose above zero after 44 consecutive negative weeks.
The same flip appeared in 2019 and 2023, with very different outcomes. In 2023, it preceded a rally from roughly $25,000 to above $70,000 within a year.
In 2019, however, BTC briefly climbed near $13,800 before sliding below $4,000 by March 2020. Last month, a separate 50-week moving average signal also returned after 45 weeks.
Is Bitcoins Four-Year Cycle Finally Broken?
Eric Crown, a member of BeInCryptos Market Intelligence Expert Council, argues the calendar itself has failed.
Expert Council
There are only 2 scenarios possible now:
1. BTC bottomed in July in which it was ahead of schedule (broken)
2. BTC bottoms anytime after today, in which it was late on its schedule (broken)
Either way, its broken… finally.

Eric KrownIndependent Technical Analyst
View profile
Previous lows arrived roughly a year after each cycle peak, pointing to an autumn 2026 bottom. Benjamin Cowen had expected an October cycle bottom before conceding in September that his bearish call failed.
Meanwhile, BTC dropped to $57,800 on July 1, roughly three months ahead of that schedule.
Has the Crowd Already Priced In the Bull Case?
CryptoQuants Analyst Consensus Index, built from votes by 164 analysts, climbed from -18.3 on July 2 to +49.2 by October 13. Over the same period, the bullish share rose from 37% to 84%.
Price has not kept pace. According to CryptoQuants data, BTC peaked near $87,000 in late September, and the current Bitcoin price sits about 6% lower.
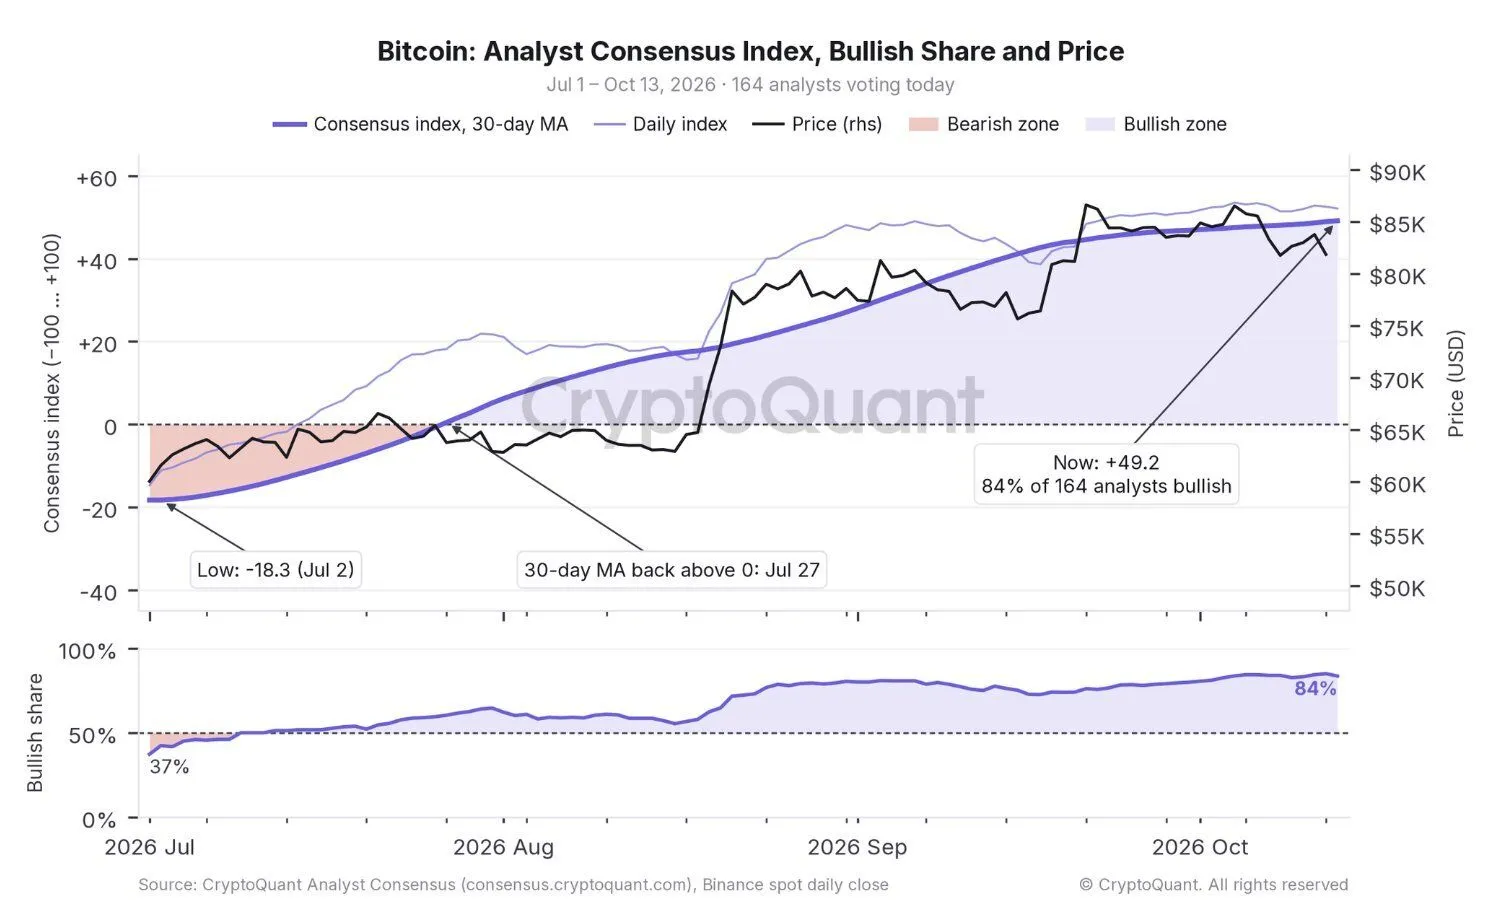
Analyst Consensus Index Source: CryptoQuant
On-chain momentum, price momentum, and analyst sentiment now point the same way. If halving math no longer sets the calendar, Bitcoins next leg may depend on whether that crowded consensus survives its first real test.