







Ethereum was priced at $3030 and the altcoin king noted a sharp decline of 11% in the past week. Major cryptocurrencies are all on a downtrend, after breaking past their immediate support levels.
Bitcoin was priced below $40k and had declined by 12% over the past week. The global cryptocurrency market cap stood at $1.96 Trillion after a decline of 0.2% over the last 24 hours.
Ethereum had witnessed a selling spree in the last week but over the last 24 hours, the coin tried to recover from the grasp of sellers, however, buying pressure is yet to resurface in the market. Recently, Ethereum developers went live with their Mainnet Shadow Fork.
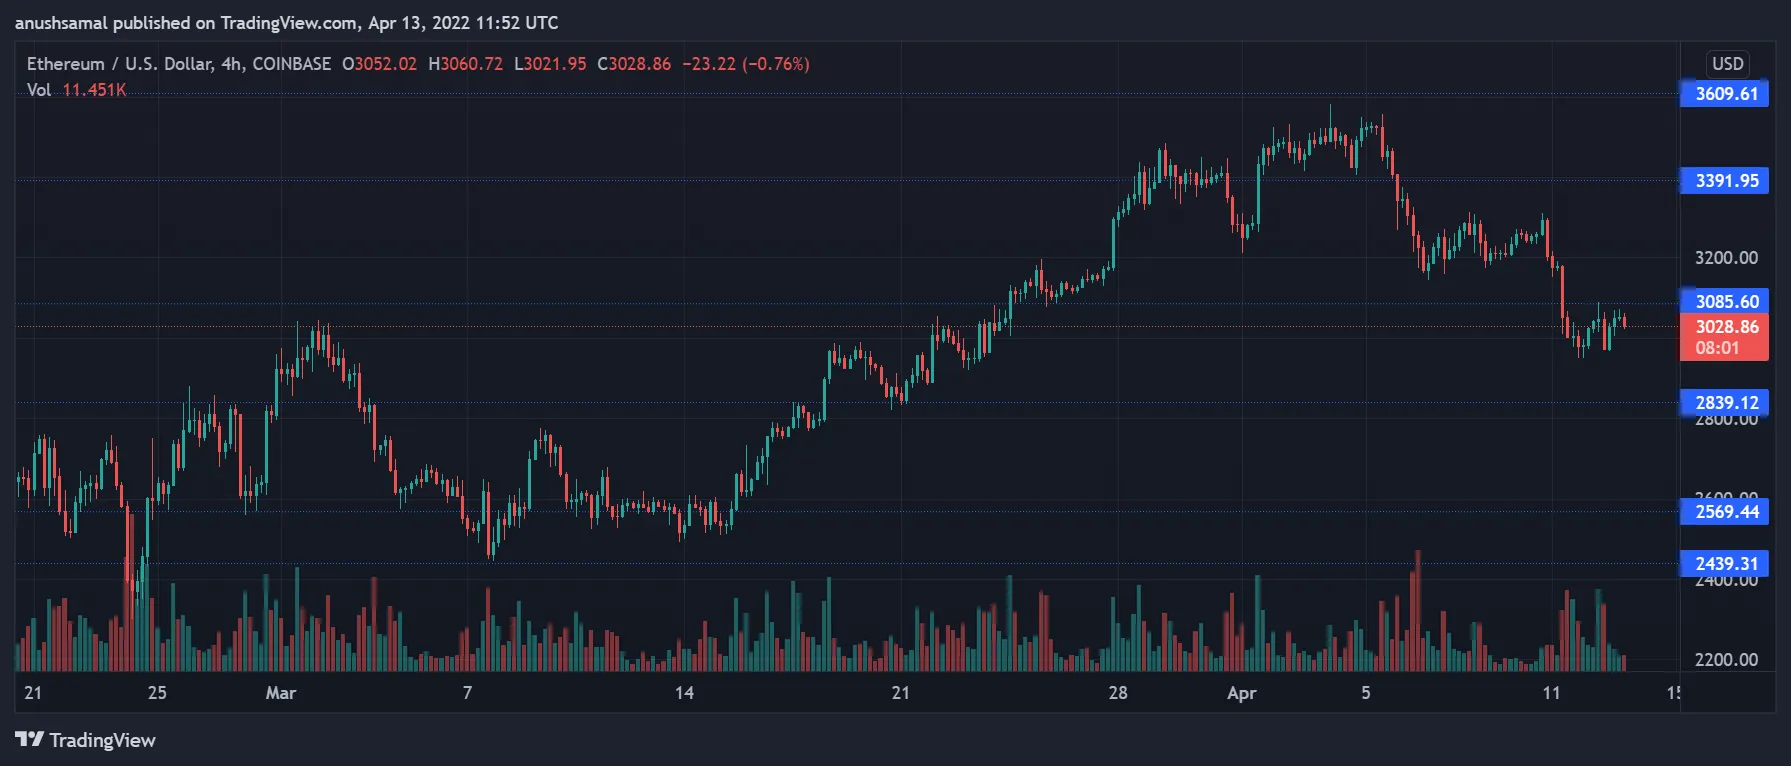
Ethereum is priced at $3028. Image Source: ETH/USD on TradingView
Ethereum was priced at $3028.86 and the coin has been hovering around the aforementioned price level over the past 48 hours. Immediate resistance for the coin stood at $3085.60 after the coin has been rejected from that level a couple of times in the past few days.
Continued rejection from the resistance mark can push Ethereum to trade near the $2839.12 support level.
A fall to that level would mean a 6.44% decline. In case the bulls resurface, the coin would aim for the resistance mark at $3391.95 and then at $3609.61. Trading volume was in red which signalled that buyers were less in number at the time of writing.
Technical Analysis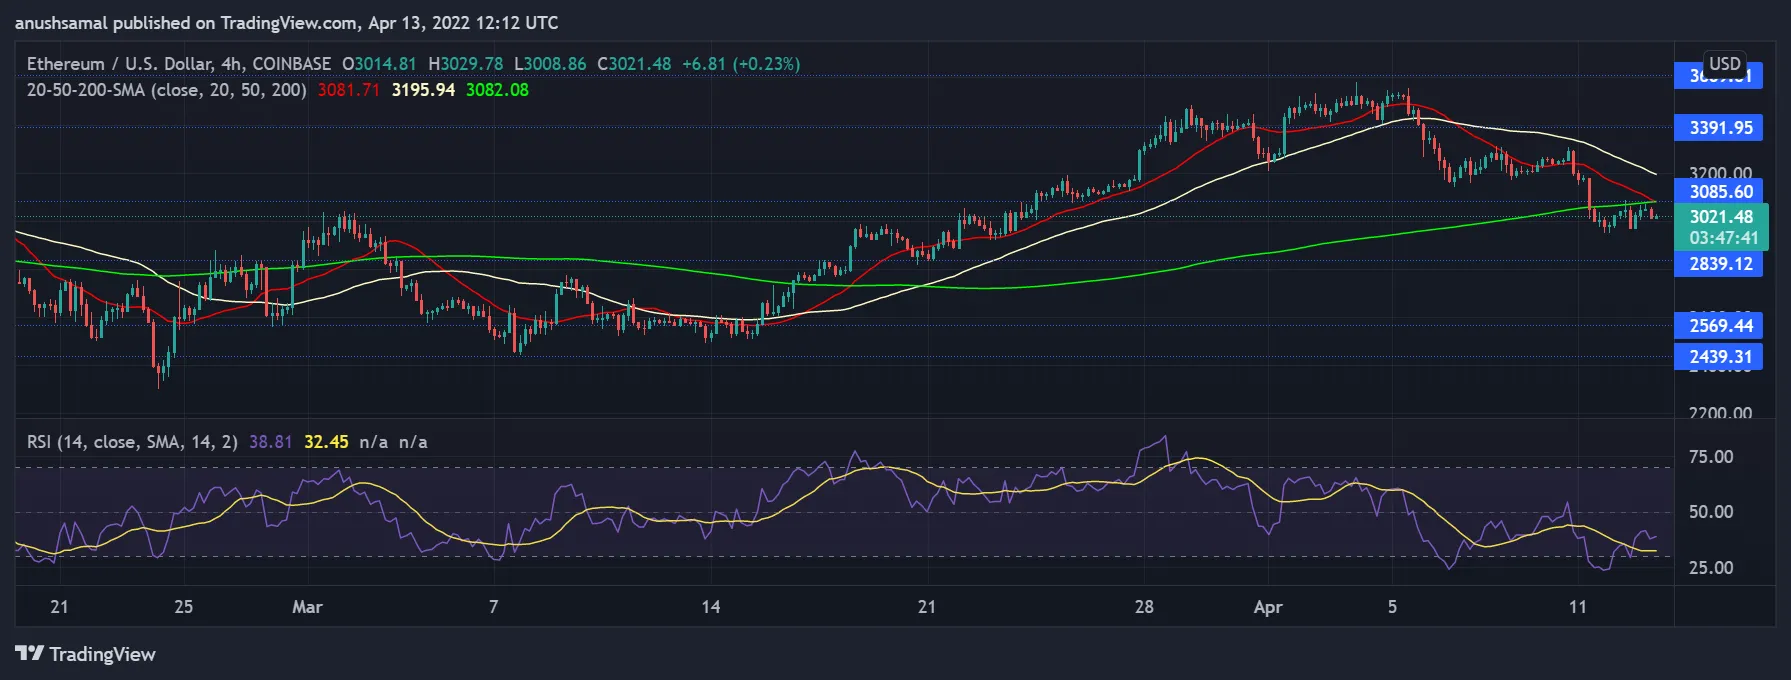
Ethereum displayed declining buying strength. Image Source: ETH/USD on TradingView
Ethereum was hovering in the oversold territory over the last 72 hours, at the time of writing the coin struggled to witness considerable buying pressure. On the Relative Strength Index, the coin was seen below the 50-mark because Ethereum was oversold and undervalued at press time. Over the last week, RSI has mostly remained below the half-line.
On the 20-SMA, ETH was seen placed below the 20-SMA line and this corresponded with the reading on the RSI. ETHs price momentum was driven by sellers according to the aforementioned indicator.
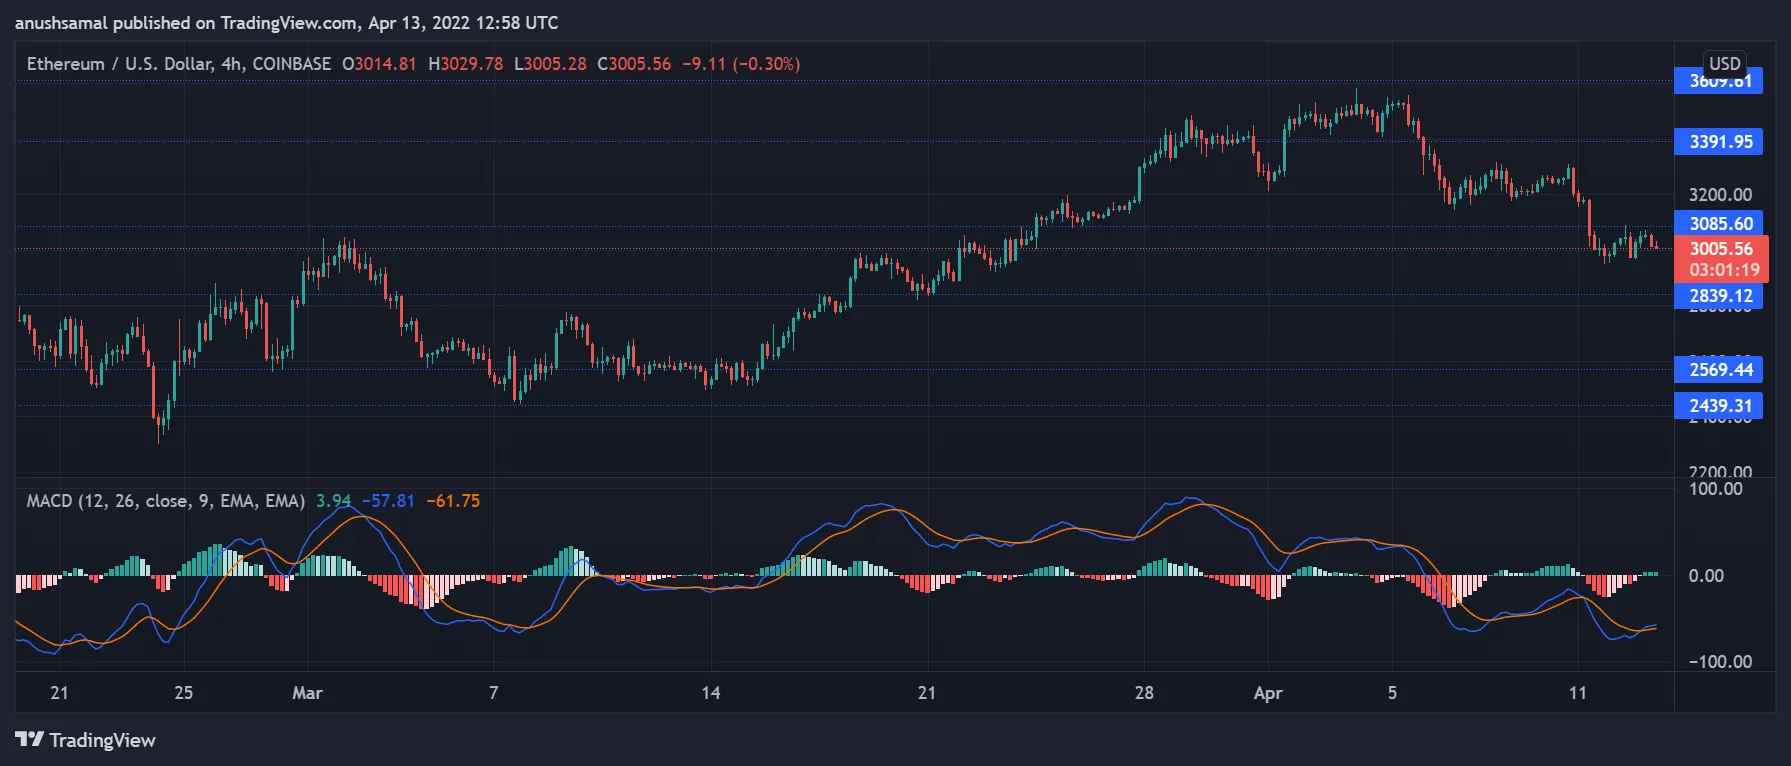
Ethereum displayed bearish momentum on its four-hour chart. Image Source: ETH/USD on TradingView
Ever since ETH was on a selling spree which is roughly a week back, the coin started to display bearish price action as it flashed a bearish momentum. At the press time, ETH continued to display bearish price action and the coin had witnessed the bulls taking over for a very brief period of time which referred to a few hours.
MACD at the moment was still negative as the indicator was seen below the zero-mark. This signals the strength of the bears. It is quite early to say if, over the upcoming trading sessions, ETH would pick up price momentum.
MACD has displayed a bullish crossover, with tiny green histograms resurfacing, however, continued price movement in the same direction will cause the indicator to remain below the half-line.