





Ethereum Classic (ETC) price is gaining attention as technical indicators and market data suggest a potential strong upward movement.
Analysts project an 800% price increase, with ETC possibly reaching $197 in the coming months.
Bullish Elliott Wave Pattern Suggests Strong Price Surge
Market analysts have identified an Elliott Wave pattern on the 1-month chart. It indicates that ETC price is currently in Wave IV and preparing for Wave V.
Historically, this wave pattern has led to strong uptrends.

Source: X
The long term up trending channel also supports this bullish outlook with a major resistance at $197.
This level can be backed by the support of $11.77 at ETC price. This makes the expectation of a breakout in the market more realistic for a longer period.
- Advertisement -
The Fibonacci 61.8% extension level aligns with the projected target, reinforcing the potential upside.
ETC Price Forms Bullish Pennant on 4-Hour Chart
Analyzing the 4-hour time frame of the ETC/USDT chart on Binance indicates the bullish pennant pattern.
This means that the current upward trend may be sustained. Bullish pennant usually appears after a rapidly rising price.
Then the price forms a triangle pattern of higher resistance lines and lower support lines.
If Ethereum Classic breaks above the pennants upper trendline, the next resistance level is between $22.50 and $24.00.
This range represents the next key level that buyers may need to overcome to confirm a longer-term rally.
If the breakout fails, ETC price may consolidate further or retrace to support levels near $19.50–$20.00.
Technical Indicators Show Strengthening Buying Pressure
This shows that the buying momentum is on the rise since the Relative Strength Index is at 60.49.
RSI can be used in this manner, for instance, if the RSI goes beyond 70, it might show that the asset is overbought, hence, there is excess demand.
If it falls below 54.32, it may point to slowing of the bullish pressure for ETC price that would in turn bring short-term bearish pressure.
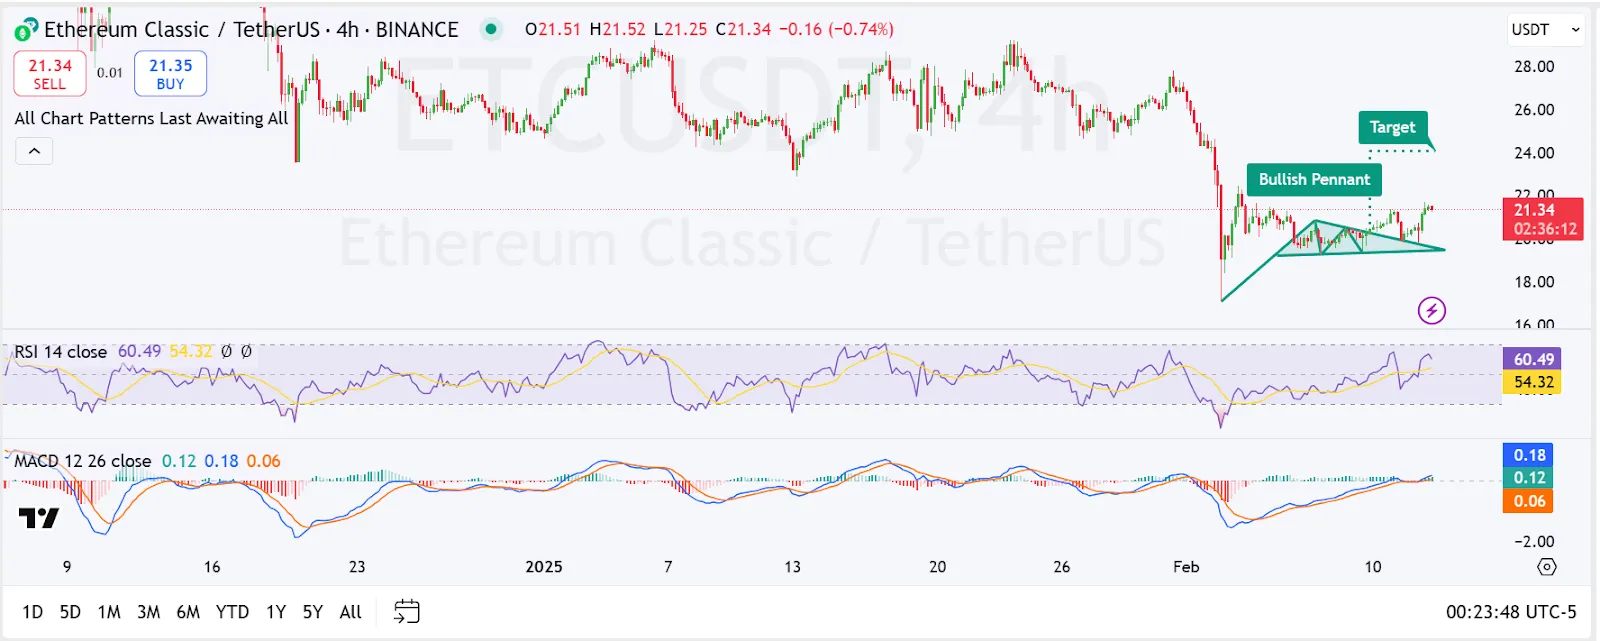
4-hour ETH trading chart| source Tradingview
The MACD (Moving Average Convergence Divergence), is also indicating a bullish inclination as the MACD line is above the signal line.
The pressure in the histogram is on the positive side, hence the expectations of the buying pressure increasing.
Furthermore , Ethereum Classics open interest (OI) has also increased by 3.73% in the last 24 hours, reaching $106.6 million.
The rise in open interest suggests that new positions are being opened, which often leads to higher volatility.
This increase in open interest is generally evidence of fresh contracts being entered, which is an indication of increase in volatility.
Whats Next for ETC Price?
However, if Ethereum Classic (ETC) price continues moving in the upward trend as currently indicated by the bullish pennant pattern, we can expect it to break out and end up moving to $24.00 in the short term.
Some analysts argue that if it is to follow the Elliott Wave pattern in the months to come, it may well reach $197.