







This analysis takes a closer look at some of Bitcoins structural market metrics and compares the current cycle to that of 2017.
The following is compiled by on-chain analyst CryptoVizArt for CryptoPotato.
Bitcoins NVT
NVT estimates the values of the network using its on-chain investor volume. As crypto analyst Willy Woo initially introduced this model, NVT Price is calculated by multiplying on-chain volume by the 2-year median value of NVT-Ratio (Market cap / Total on-chain transfer volume).
Back in 2018, after touching the cycles top, both 30-day & 90-day MA of NVT-price have declined continuously for almost 12 months. However, since the 50% drop that took place in May 2021, these moving averages are rising to levels above their previous peaks at 64K.
This variation in NVT-based pricing results could be translated to a higher institutional activity level compared to retailers.
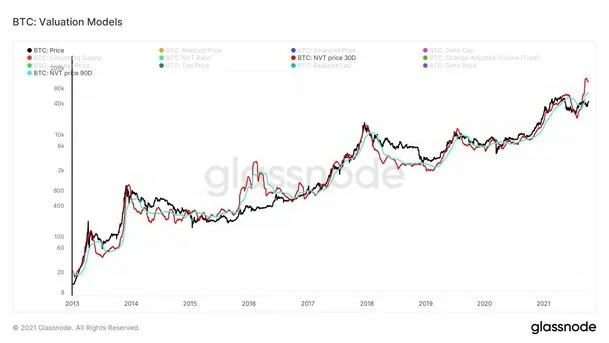
Chart by Glassnode
Categorical Analysis of On-Chain Activity
Historically, in all former crypto market cycles, both the 7-day MA of on-chain transfer volume Mean & Median sizes have spiked up to over 4X of their 360-day MA level and then dropped below 1X their 360-day MA.
The Mean and Median size of on-chain transfer volume are the proxies for larger and smaller transactions. When the Mean value rises, it means high-volume transactions are happening more frequently. Median size, on the other hand, is a proxy for small transactions attributed to retailers.
Surprisingly, there has not been an over 4X spike. Additionally, the Mean value has always correlated with the Median, meaning the activity level for both large entities and minor retailers was growing with price rally to the new ATH up to more than 4X of their 360-day MA.
Amazingly, there has been a significant divergence between the Median value and Mean value. This divergence also points out the larger entities footprint in this ecosystem with a different conviction and vision.
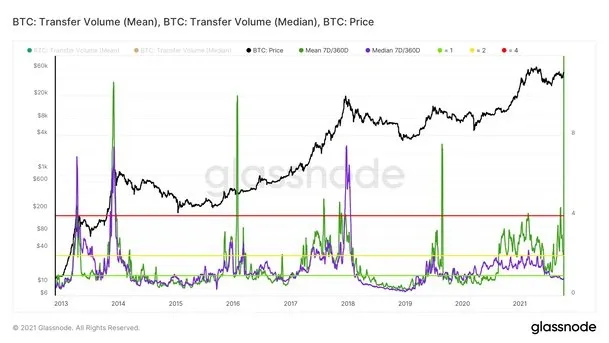
Chart by Glassnode
The Fund Flow Ratio of Bitcoin: Are Insitionals Here?
Following the discussed apparent footprint of large entities above, another valuable on-chain metric, called Fund Flow Ratio, can be studied to evaluate this assumption.
Institutional players are majorly transferring their assets off the exchanges (on-chain). Therefore, we can trace the categorys weight by measuring the Fund Flow Ratio (on-chain transfer volume that is not sent to/withdrawn from exchanges divided by total on-chain transfer volume). Studying the historical trend of this ratio is evidence that it decreased subsequently after reaching the ATH and entering the bear market.
This ratio, however, has been increasing since Jan 2021, despite the 50% market correction in May. Almost 96% of the on-chain transactions are not attributed to exchanges withdraws/deposits. The simple conclusion can be that institutional involvement in crypto markets is increasing.
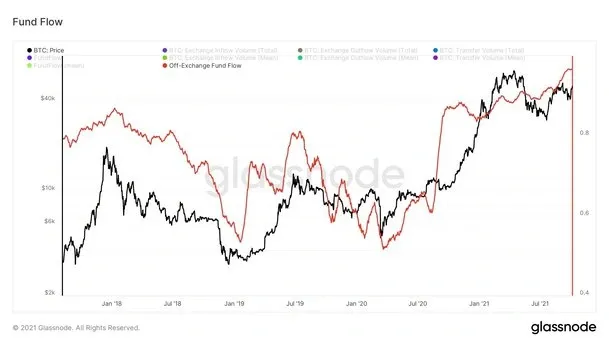
Chart by Glassnode
For more blockchain news, please download WikiBit- the Global Blockchain Regulatory Inquiry APP.