






- Zilliqa price drops 3.6%, extending a 7-day downtrend amid weak market sentiment.
- Binance delisting and Upbit supply increase reduce liquidity and add pressure.
- Technicals show ZIL below key EMAs with RSI near oversold levels.
Zilliqa (ZIL) has seen a sharp dip in its price over the past 24 hours.
The token is currently trading at $0.004822, down 3.6%, underperforming the broader cryptocurrency market, which fell by 0.9%.
This decline extends a seven-day downtrend of approximately 7.75%, signalling sustained bearish sentiment.
Exchange delistings and market liquidity
One of the main drivers behind ZILs recent weakness is exchange delistings.
On January 23, 2026, Binance removed the ZIL/BTC spot trading pair as part of its market quality optimisation.
This followed a prior delisting of the ZIL/BTC margin pair in June 2025.
Delisting reduces liquidity and arbitrage opportunities for traders.
It also signals declining exchange support, often prompting sell-offs as market participants adjust their positions.
With fewer direct BTC and ETH trading pairs, ZIL now relies heavily on USD-stable pairs like ZIL/USDT for trading volume.
Traders are closely watching whether liquidity consolidates or further fragments on these remaining pairs.
Supply update adds to the downward pressure
Another factor influencing ZILs decline is a recent circulating supply update.
Upbit reported an increase of 443,195,861 ZIL in the first quarter of 2025.
This adjustment raised the circulating supply from roughly 19.905 billion to 20.349 billion ZIL.
The increase, representing about 2.2% of the quarterly supply, reflects staking rewards, protocol inflation, and team token unlocks.
A larger supply can dilute the value of each token if demand does not increase proportionally.
Public confirmation of the supply increase often renews focus on potential sell-side pressure, especially during periods of market weakness.
Combined with reduced exchange liquidity, the supply update has amplified bearish sentiment among traders.
ZIL technical analysis
Technical indicators further reinforce ZILs short-term bearish trend.
The token is trading below all major exponential moving averages on the daily chart.
Its 7-day simple moving average sits at $0.00497, while the 30-day SMA is at $0.00519, both above the current price.
The 14-day relative strength index (RSI) is 38.37, suggesting that the token is approaching oversold conditions.
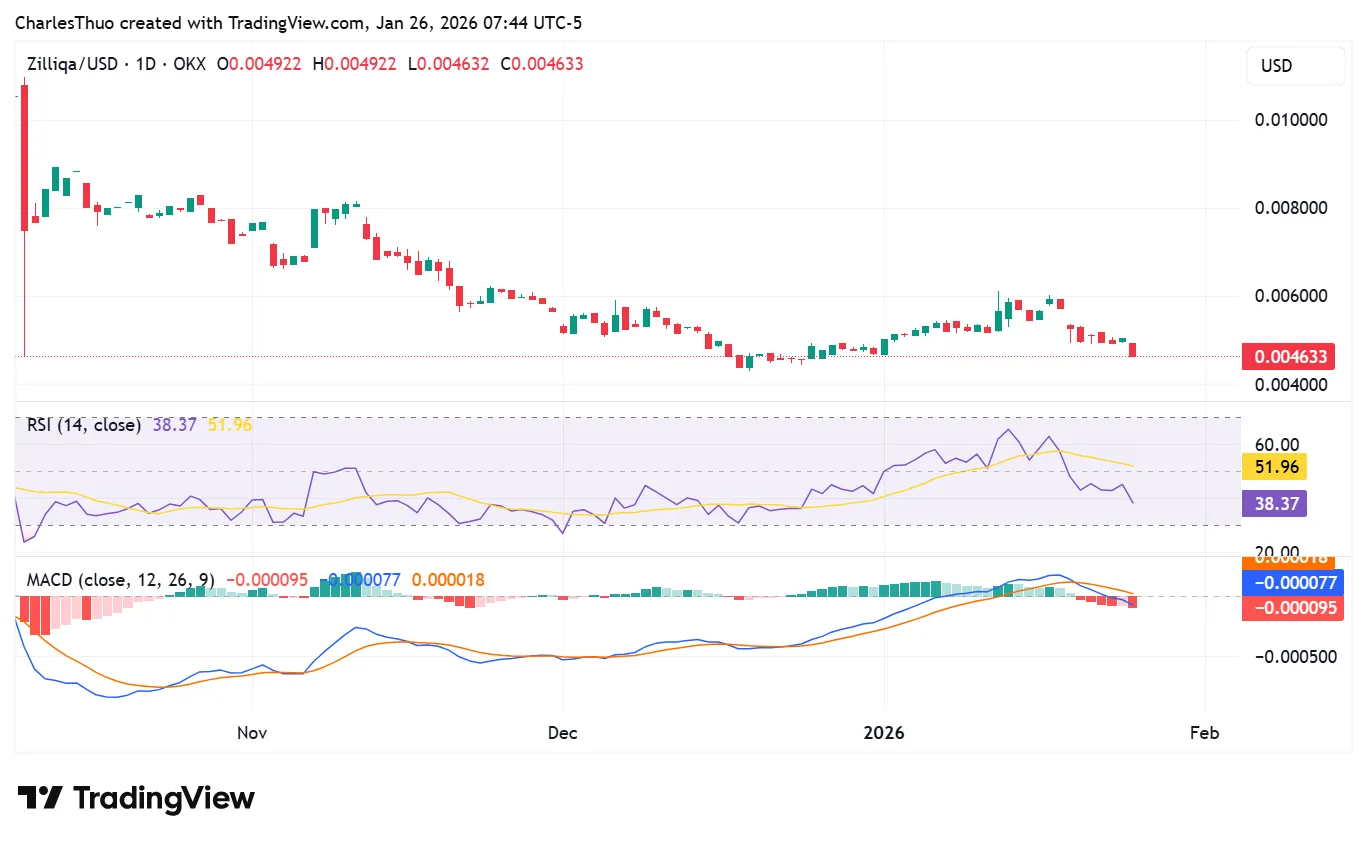
Zilliqa price chart | Source: TradingView
Meanwhile, the weekly RSI stands at 47.00, indicating neutral market conditions.
The MACD histogram is negative at –0.000095, confirming continued bearish momentum.
These technical signals suggest that selling pressure remains, although short-term consolidation could occur due to the oversold conditions.
Zilliqa price forecast
Traders should keep a close eye on key support and resistance levels in the coming days.
The immediate support is near the recent swing low of $0.0045846, which may act as a floor for further declines, according to analysts.
On the upside, the first significant resistance is at $0.0669, a level that ZIL must close above to trigger a potential trend reversal.
Market participants should also monitor trading volumes on remaining pairs to gauge whether the sell-off is stabilising.
Short-term price action will likely be influenced by liquidity trends, supply dynamics, and technical momentum.
Until a bullish catalyst emerges, ZIL may continue to face pressure, with consolidation around current levels being the most probable scenario.