




Artificial Superintelligence Alliance [$FET] is currently benefiting from a rally linked to the broader artificial intelligence token narrative. The asset posted a 10% gain at press time, as chart projections point to another double-digit move to the upside.
Despite this, there is a high probability that the rally may not fully materialize, as opposing forces point to weakening buyer strength in the $FET market.
$FET forms a bullish flag pattern
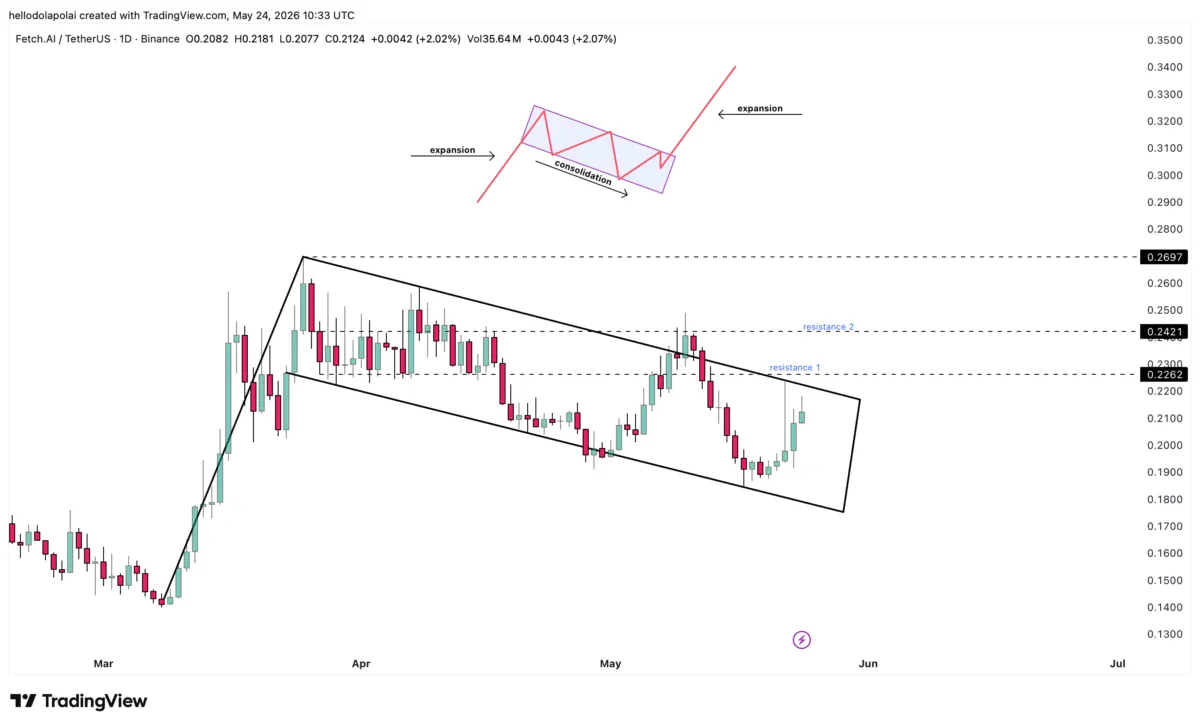
At the time of writing, $FET was trading within a classic bullish flag pattern, a formation that has historically preceded significant price swings to the upside. The pattern forms when an asset undergoes a massive expansion in price, then consolidates within a slightly downward-trending channel before making another major upswing.
$FET has already passed through two phases of this pattern, completing the initial expansion and currently consolidating within the downward channel.
Source: TradingView
The third and final phase would see $FET break above the upper resistance of the downward channel, with two price targets ahead: $0.22 and $0.24.
Whether this expansion materializes, however, depends heavily on whether momentum and capital conditions align to support the breakout.
$FET capital outflow dominates
The momentum picture on the chart points to minimal immediate tendency for an upside move. Both momentum and capital flow indicators are currently working against the bullish flag projection.
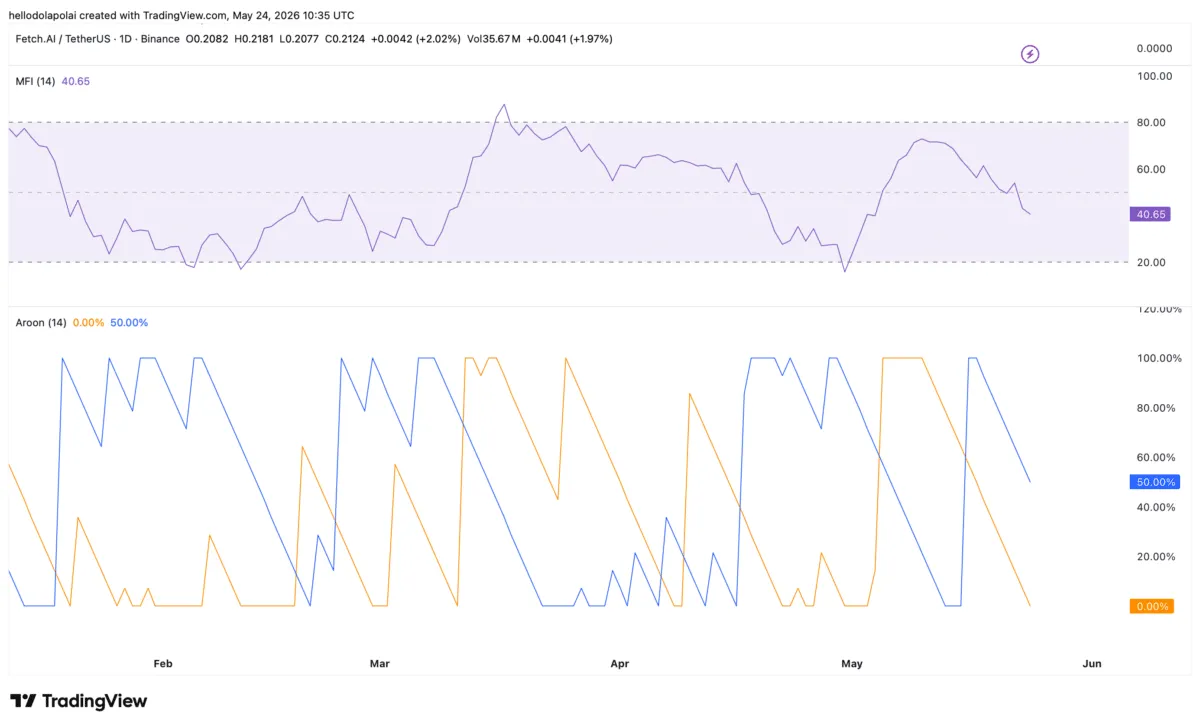
The Aroon indicator, which tracks the strength and direction of momentum in the market, shows that buying power has dropped significantly.
At press time, the Aroon Up, which represents buying momentum, had fallen to 0.00%, while the Aroon Down sat at 50%. Whenever the Aroon Up falls below the Aroon Down, it signals that buying momentum has weakened and that sellers are currently driving the market. At 0.00%, buying power is effectively absent at this stage.
Source: TradingView
Capital movement has compounded this reading. The Money Flow Index, which tracks the inflow and outflow of capital from an asset, has dropped significantly below the 50 mark on the chart, indicating that capital outflow is the dominant condition at the time of writing.
With the MFI line continuing to fall, selling pressure remains active. Capital outflow and weakening momentum together represent a significant headwind to the bullish outcome that the flag pattern projects.
Liquidity clusters reveal…
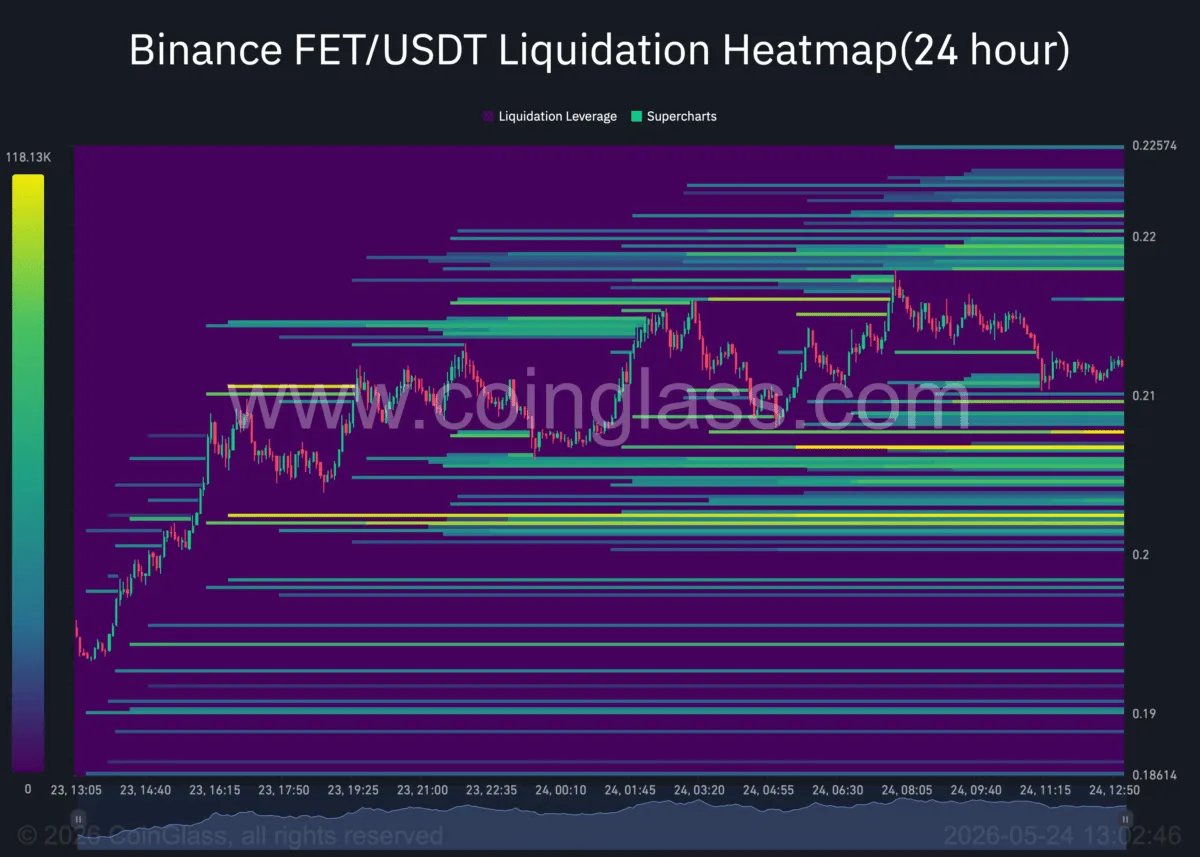
The liquidation heatmap adds a layer of nuance to the near-term directional outlook, with liquidity clusters sitting on both sides of price. At the time of writing, the balance of cluster positioning leans toward an upward move, strengthening the case for $FET to rise above its current level.
Source: TradingView
The downside risk, however, cannot be overlooked. Liquidation data shows that the gap between long and short trader losses remains relatively narrow, with short traders recording $33,490 in losses compared to $45,740 on the long side, a disparity of just $12,250.
This tight gap suggests the recent rally has not fully offset the losses sitting on the long side, and a reversal remains a credible possibility at this stage.
Final Summary
- $FET is consolidating within a bullish flag pattern, targeting $0.22 and $0.24.
- Long liquidations at $45,740 outpace short losses of $33,490, suggesting the rally has yet to fully offset downside risk.