







BNB/USD price is currently exchanging hands at $419 following a 61% rally from the July 20 low at $256. This rally saw the largest crypto exchange token flip the 200-, 100-, and the 50-period Simple Moving Averages from resistance to support and spelt out an ascending parallel channel as seen on the four-hour chart.
The rising channels lower boundary provided significant support that ensured that bears were did not significantly undo the ensuring gains. On the other hand, bullish pressure was continuously rejected by the upper boundary. Meanwhile, the break above the middle boundary on August 11 is an indication that Binance Coin prediction remains bullish.
BNB/USD Four-Hour Chart
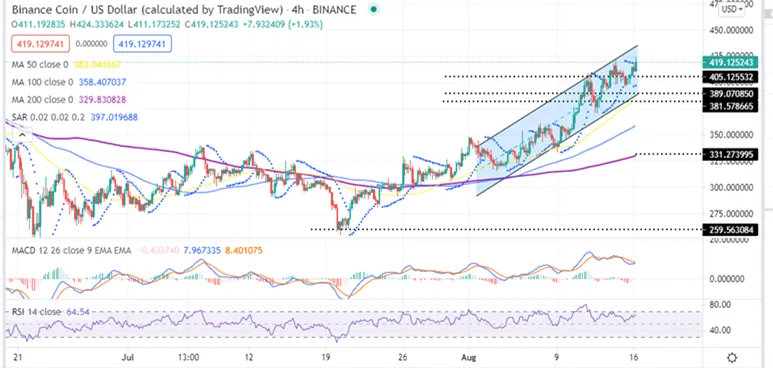
Technical indicators on the same four hour-chart shows that BNB will remains bullish in the near term. For example, the upwards movement of the Relative Strength Index (RSI) towards the overbought zone is an indication that the buyers are in control of the Binance Coin price. Moreover, the parabolic SAR reversed from negative to positive today morning adding credence to this optimistic outlook.
Furthermore, the position of the Moving Average Convergence Divergence (MACD) indicator in the positive region above the mean line accentuates this bullish narrative. Note that the MACD could send a buy signal over the next trading sessions affirming the bullish narrative. This will happen when the MACD line (blue) crosses above the signal line (orange).
Stay tuned!