







The Graph (GRT) price is seeing some recovery as the Artificial Intelligence (AI) token market rises ahead of Nvidias Q1, 24 earnings report.
Nvidia earnings and price outlook for AI tokens
As Invezz highlighted earlier today, the sentiment around the chipmakers much anticipated earnings report saw crypto tokens such as Render and Akash Network soar.
Nvidia reported after markets closed on Wednesday.
The companys stock price is 7% up in premarket trading on Thursday and a fresh wave of buy pressure is building for Bittensor (TAO) and AIOZ Network (AIOZ) and The Graph (GRT).
The Graph price surges amid Sunrise Upgrade Program
Indexing protocol The Graph is one of the tokens to flip green in the past week as Bitcoin and Ethereum prices hovered higher.
GRT‘s gains however come amid positive response to The Graph’s Sunrise Upgrade Program, which recently launched with 4 million GRT tokens earmarked for rewards to participants.
The Graph‘s price has increased by more than 18% this past week and is 3% up in the past 24 hours ahead of Nvidia’s first quarter earnings. The potential rally for cryptocurrencies amid a possible SEC approval of the first spot Ether ETF in the US could also catalyse parabolic gains for GRT.
The Graph price: key levels to watch
The Graph token currently trades around $0.3519. According to CoinGecko, the 24-hour range is $0.3311 – $0.3558, while GRT has traded between $0.2969 and $0.3542 over the past week.
A look at GRT price charts also shows that the token traded to lows of $0.21 in mid-April and struggled to break above $0.32 on multiple occasions this past month.
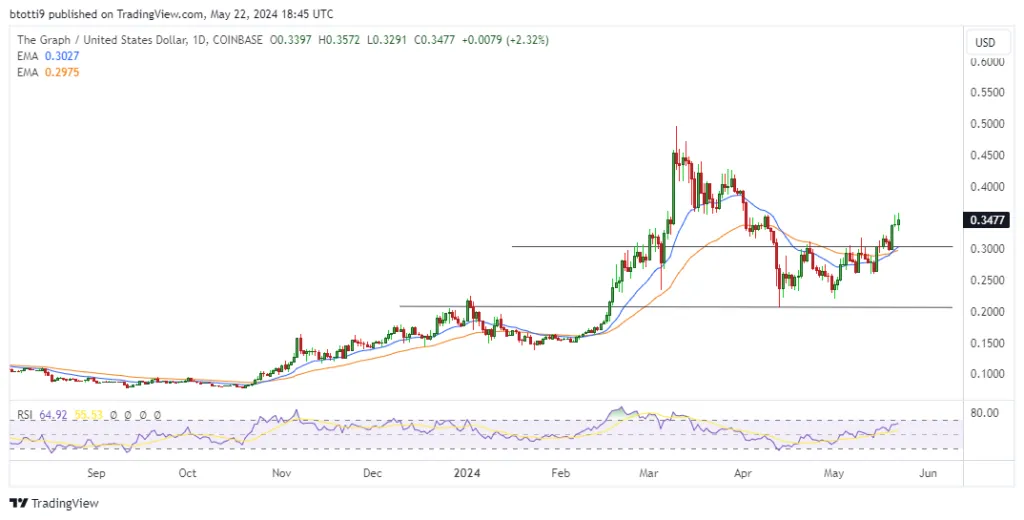
The Graph price on the daily chart. Source: TradingView
From current levels, this puts key areas to watch on the downside at $0.3 and $0.21. The current price is above the 20-day and 50-day exponential moving averages, which could provide robust support above the horizontal line.
The Relative Strength Index (RSI) on the daily chart is also rising but not extended into the overbought territory. This suggests buying pressure for GRT, an outlook also suggested by the Moving Average Convergence Divergence (MACD).
If bulls break above the resistance zone at $0.35, they could target $0.5 and $0.7. The psychological level of $1 remains the primary short term target.
The post The Graph (GRT) price: Key levels as bulls eye breakout appeared first on Invezz