





Este artículo también está disponible en español.
MATIC is under mounting bearish pressure as it continues its downward slide, drawing closer to a critical support level at $0.3132. A break below $0.3132 could open the door to additional losses, signaling a deeper bearish trend ahead. With the market sentiment turning increasingly negative, speculations are whether the bears can push the price beyond this vital support zone or if the support will hold firm against the downward momentum.
As MATIC hovers near the crucial $0.3132 support level, this article aims to analyze its current price action by examining key technical indicators and market sentiment. It explores the potential outcomes if MATIC breaches this level and what this could mean for the cryptocurrencys future trend.
Current Market Overview: Bearish Sentiment Dominates
On the 4-hour chart, after successfully breaking below the $0.5030 mark, MATIC has continued to build negative momentum dropping under the 100-day Simple Moving Average (SMA) as it moves toward the $0.3132 support level. The digital asset has maintained a consistent downward trend, indicating that the bears remain firmly in control and could drive the price even lower if the selling pressure persists.
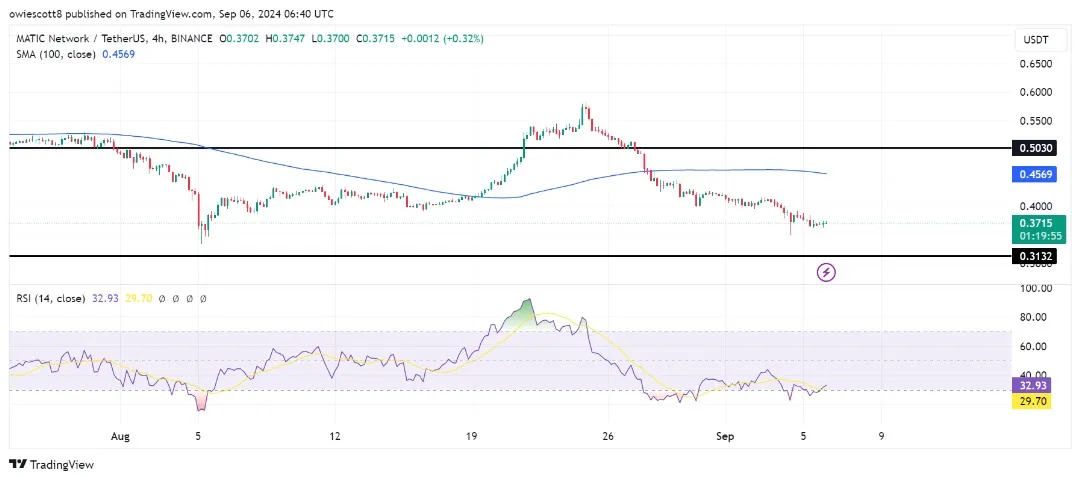
Additionally, the 4-hour Relative Strength Index (RSI) shows that the signal line is well below the 50% threshold, situated at 33%. A sustained RSI reading below 50% suggests that the downward trend could continue, reinforcing the likelihood of additional declines as bearish sentiment remains strong.
On the daily chart, MATIC is also exhibiting significant pessimistic movement as it trades below both the 100-day Simple Moving Average (SMA) and the $0.3132 support level. The formation of multiple bearish candlesticks underscores the prevailing negative sentiment and suggests that downbeat pressure remains dominant. This persistent drop indicates that the bears are maintaining control, and without a shift in momentum, MATIC may face further declines.
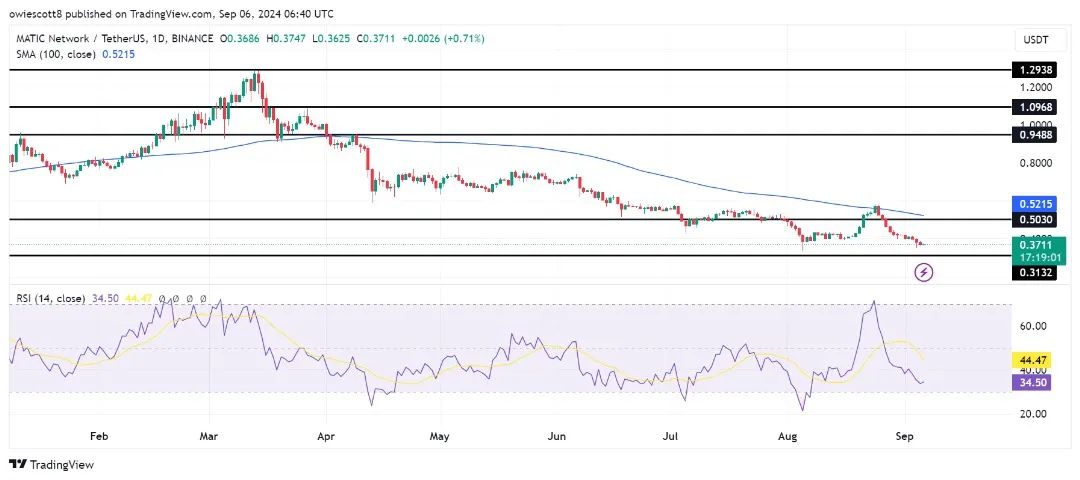
Finally, on the 1-day chart, the RSI signal line has significantly dropped below the 50% threshold, currently sitting at 34%. This sharp decline below the 50% mark suggests a strong downside sentiment and pressure if the trend continues.
A Breakout Or Breakdown Ahead For MATIC?
As MATIC hovers near the $0.3132 support level, two primary scenarios are unfolding. Should the price hold above this level, it could signal a bullish reversal, targeting higher resistance levels such as $0.5030 or beyond. Conversely, a break below $0.3132 could exacerbate the bearish trend, leading to deeper declines toward the next support zone.
MATIC is trading around $0.372, marking a 1.11% decline, with a market capitalization of over $1.7 billion and a trading volume exceeding $170 million, as of the time of writing. Also, in the past 24 hours, MATICs market cap has decreased by 1.25%, and its trading volume has dropped by 35.49%.
Featured image from Adobe Stock, chart from Tradingview.com