






- Arbitrum price hovered near $0.10 as cryptocurrencies saw fresh declines.
- The token was down nearly 20% in the past week and 45% over the past month.
- Robinhood Chain has launched its public testnet on Arbitrum.
Arbitrum ($ARB) traded around $0.10 at the time of writing on Wednesday, with bulls looking to break above $0.11 following an intraday dip amid broader market weakness.
Ethereum and XRP prices were all down on the day as Bitcoin dropped under $65k again.
The slight dip for $ARB as of early US trading hours came as the latest network developments saw Robinhood announce the public testnet launch of its real-world asset platform on Arbitrum.
Arbitrum price hovers near $0.10
The $ARB token traded at highs of $0.22 on January 14, 2026. However, as bearish sentiment that has carried from Q4, 2025 decimated crypto bulls, $ARB steadily fell and hit lows of $0.099 on Feb 5.
Despite a bounce to $0.12, prices are back near this critical level.
On Wednesday, broader weakness remained a key factor across crypto.
However, Arbitrum shared news that the Robinhood Chain was now live in public testnet, and developers can tap into its infrastructure to support tokenized real-world and digital assets.
Robinhood Chain testnet is now live on the Arbitrum platform.
Phase 1 focuses on developer onboarding and infrastructure testing:
Testnet gas + Stock Tokens
Contract deployment
Bridging + explorer visibility
This allows tokenized asset flows to be tested without production… pic.twitter.com/gtLvKDxVVH
— Arbitrum (@arbitrum) February 11, 2026
From a network growth viewpoint, this is hugely positive news for Arbitrum.
But can bulls ride it as a fresh catalyst for a rebound? The altcoin is down more than 20% in the past week and by over 45% in the past month.
Arbitrum price forecast
As noted, the $ARB token has experienced a sharp decline since peaking at highs of $0.62 in August 2025.
The October 10 crash saw it plummet to lows of $0.10.
Prices briefly steadied to $0.36, but the overall downtrend resumed and $ARB broke to $0.094 amid the February 5, 2026, crypto market route.
That crash below the critical support level of $0.10 accelerated the weakness, and an extended downtrend of five months saw the token hit its all-time low.
$ARB price is up 13% from that low, but in terms of technical analysis, the daily chart shows $ARB continues to trend with an entrenched bearish structure.
For instance, the current price is below the 20-day EMA, which offers upside resistance around $0.13.
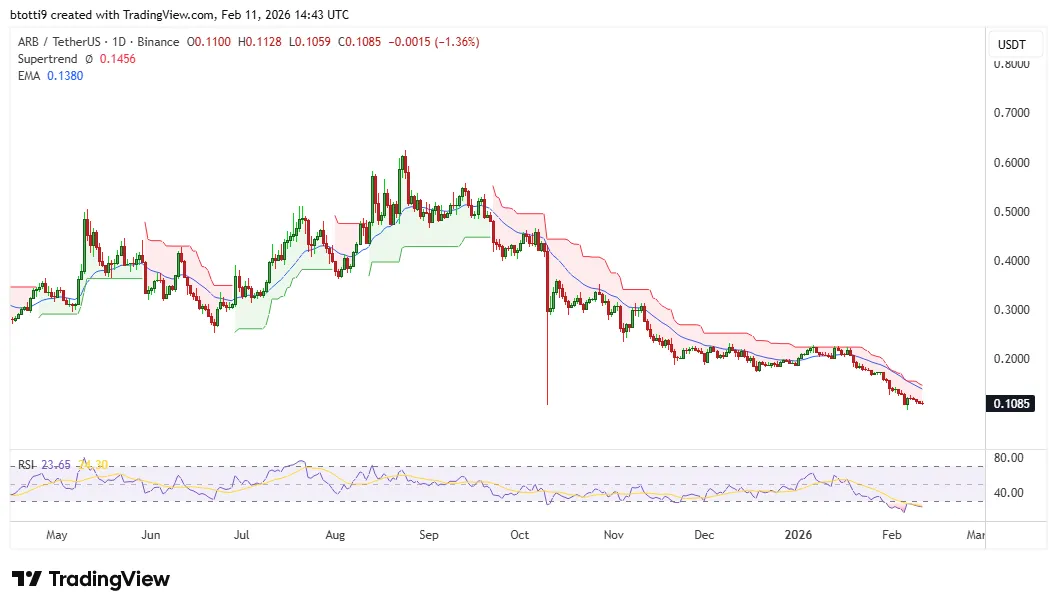
$ARB price chart by TradingView
Meanwhile, the Relative Strength Index (RSI) hovers in oversold territory at 24, signaling potential exhaustion.
However, theres no immediate reversal formation yet, and the Supertrend indicator is flashing bearish signals.
The price trajectory points lower, and short-term bearish continuation could see $ARB dip to a new all-time low under $0.09.
On the flipside, if oversold conditions trigger a bounce, the further strength above $0.13-$0.15 highlights the next targets at $0.22 and $0.35.