






In brief
- CryptoQuant says the largest XRP cohorts are adding supply as price holds the $1.00–$1.20 range, with neutral order flow pointing to quiet absorption.
- XRP's realized price sits near $0.75 versus a market price around $1.10, a gap the firm calls a late-bear-market zone.
- The daily chart tells the same story: a death cross, price below both moving averages, and weak trend strength.
Across some of the crypto markets biggest assets, including Bitcoin, Ethereum, and XRP, whales are adding to their bags, according to research from CryptoQuant.
Julio Moreno, the company‘s head of research, said in a report that these coin’s largest cohorts are adding supply as prices sit near or below their average purchase cost. “This positioning lowers downside pressure and is consistent with the final phase of the cycle's decline,” he wrote in the firm's weekly report.
In other words, we might be nearing the tailend of the crypto bear market.
For XRP specifically, CryptoQuant said spot order sizes stay in “big whale” territory even as the token holds the $1.00–$1.20 band, hovering around a $66 billion market capitalization. But the 90-day taker cumulative volume delta—a read on aggressive buying and selling—has drifted to neutral. The firm said that big, low-key buy orders, paired with roughly equal levels of buying and selling pressure, point to a calm accumulation phase—investors are holding steady rather than fleeing, but they haven't started pushing prices higher in earnest either.
The setup fits a sustained pattern. Bitcoin's bear market has been unusually shallow, and analysts have debated whether the bottom is in using arguments similar to what CryptoQuant applies to XRP.
XRP price: What the charts say
XRP was changing hands at $1.05 on Binance at press time, down 1.4% on the day, in line with Decrypt's earlier read of the token near $1.10. The daily chart backs up the on-chain picture: This is a market basing (flattening), not breaking down.
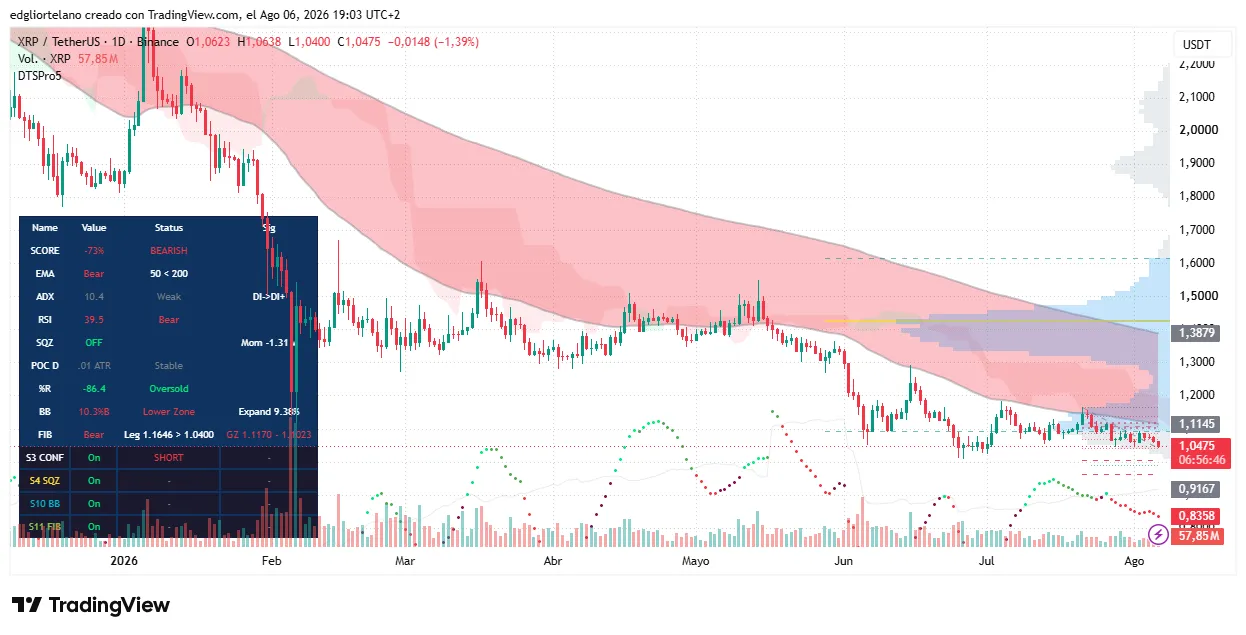
XRP price data. Image: Tradingview
The 50-day exponential moving average sits below the 200-day, forming a pattern that traders refer to as a death cross. Thats not good, and is a classic bearish indicator. The current price of XRP is trading under both averages, parked up in the $1.30–$1.60 zone. A death cross is a lagging signal, but it confirms the trend is still down.
The relative strength index, or RSI, is 39.5, below the 50 line that splits bullish from bearish momentum and closing in on oversold (30) without tipping there. The average directional index, or ADX, is 10.4, which means there's no strong trend powering the move right now, just chop. Squeeze momentum is off, with negative momentum, so volatility is compressed rather than expanding.
The trajectory reads as a late-stage bear basing coil, basically prices going flat for a prolonged time. XRP has fallen from around $2.20 in early 2026 into a long, flat range near $1. The chart and the on-chain data agree—whales are absorbing, not capitulating, and the structure looks like a bottoming range rather than a fresh leg down.
The catch is direction: With XRPs price below a death cross and momentum still negative, there's no confirmation of a turn. A daily close back above the 200-day EMA, around $1.12, would be the first real signal the accumulation is paying off.
Immediate support is the $1.04 area (the current print and the lower bound of the basing range); a clean break opens $0.9167, then $0.8358. Resistance starts at the $1.1145 Fibonacci mark, with the bigger ceiling at $1.60.