




The U.S. Bureau of Labor Statistics publishes October‘s consumer price index (CPI) on Tuesday, November 10, at 8:30 a.m. in New York, or 13:30 UTC. The Bitcoin CPI reaction that follows could set the tone for the week. The CPI is the main U.S. measure of inflation, and it will shape the Federal Reserve’s next rate decision.
Economists expect core prices, which leave out food and energy, to have risen about 0.22% in the month. That would be a slowdown from Septembers 0.33%.
Economists expect growth in the core CPI to have moderated in October to around 0.22%, though the full range of estimates is broad enough to round down to 0.1% or round up to 0.3%.
Due to the government shutdown in Oct 2025, there's no tidy year-earlier figure. pic.twitter.com/CFM7ikw8fO
— Nick Timiraos (@NickTimiraos) November 9, 2026
Bitcoin trades near $74,400, still close to Sundays two-month low of $73,510.
CPI days move crypto. We checked Bitcoins first hour after the last 24 releases. When core inflation came in at 0.2% or lower, BTC rose in that hour 10 times out of 13. When it came in at 0.3% or higher, it rose only 4 times out of 10.
So which way will todays number push Bitcoin?
Economists Expect Inflation to Cool, but the Range Is Wide
The forecasts point to a calmer month. Seventeen banks and research firms surveyed by The Wall Street Journal see a median rise of 0.25% for headline CPI and 0.22% for core. Journal reporter Nick Timiraos posted the table on X.
- Headline CPI:forecasts run from 0.14% at Nomura to 0.29% at Pinebrook Capital, against 0.65% in September.
- Core CPI:forecasts run from 0.13% at Nomura to 0.28% at BNP Paribas and Pinebrook, against 0.33% in September.
- Yearly rate:the BLS put Septembers inflation at 3.7% for headline prices and 2.6% for core.
That spread matters. The government reports CPI rounded to one decimal place. With forecasts this spread out, the core reading could print anywhere from 0.1% to 0.3%. A 0.3% would match Septembers pace and read as inflation that is not cooling.
The yearly comparison will also be messy. The government shutdown in October 2025 meant no CPI was published for that month, so there is no clean year-over-year figure.
Market Intelligence: Crypto Analyst Predicts Best Low-Cap Crypto
Todays Report Is the Last CPI Before a Likely Fed Hike
This is the last CPI report the Federal Reserve will see before its December 8-9 meeting. Traders already expect a rate hike: on Tuesday morning, Polymarket gives an 86.5% chance of a 0.25-point increase and 11.5% for no change.
Higher rates tend to weigh on Bitcoin. They make cash and bonds pay more, which pulls money away from assets that pay no interest, like crypto.
A cool reading could shave those odds and give Bitcoin room to bounce. A hot one would lock in the hike.
DISCOVER:Fed Meeting Today: Traders Price a 95% Hold and a 79% December Hike. What Does It Mean for Crypto?
The Bitcoin CPI Reaction: Cool Prints Usually Lift BTC Within the Hour
We measured the Bitcoin CPI reaction on Binance. We took the 24 CPI reports published since October 2024 and measured Bitcoins move in the hour after each 8:30 a.m. release.
- Bigger swings:the median gap between BTCs high and low in that hour was 1.17%, almost double the 0.62% in the same hour on other weekdays.
- Core at 0.2% or lower, 13 reports:BTC rose in the first hour 10 times, by 0.45% on average.
- Core at 0.3% or higher, 10 reports:BTC rose only 4 times and slipped 0.11% on average.
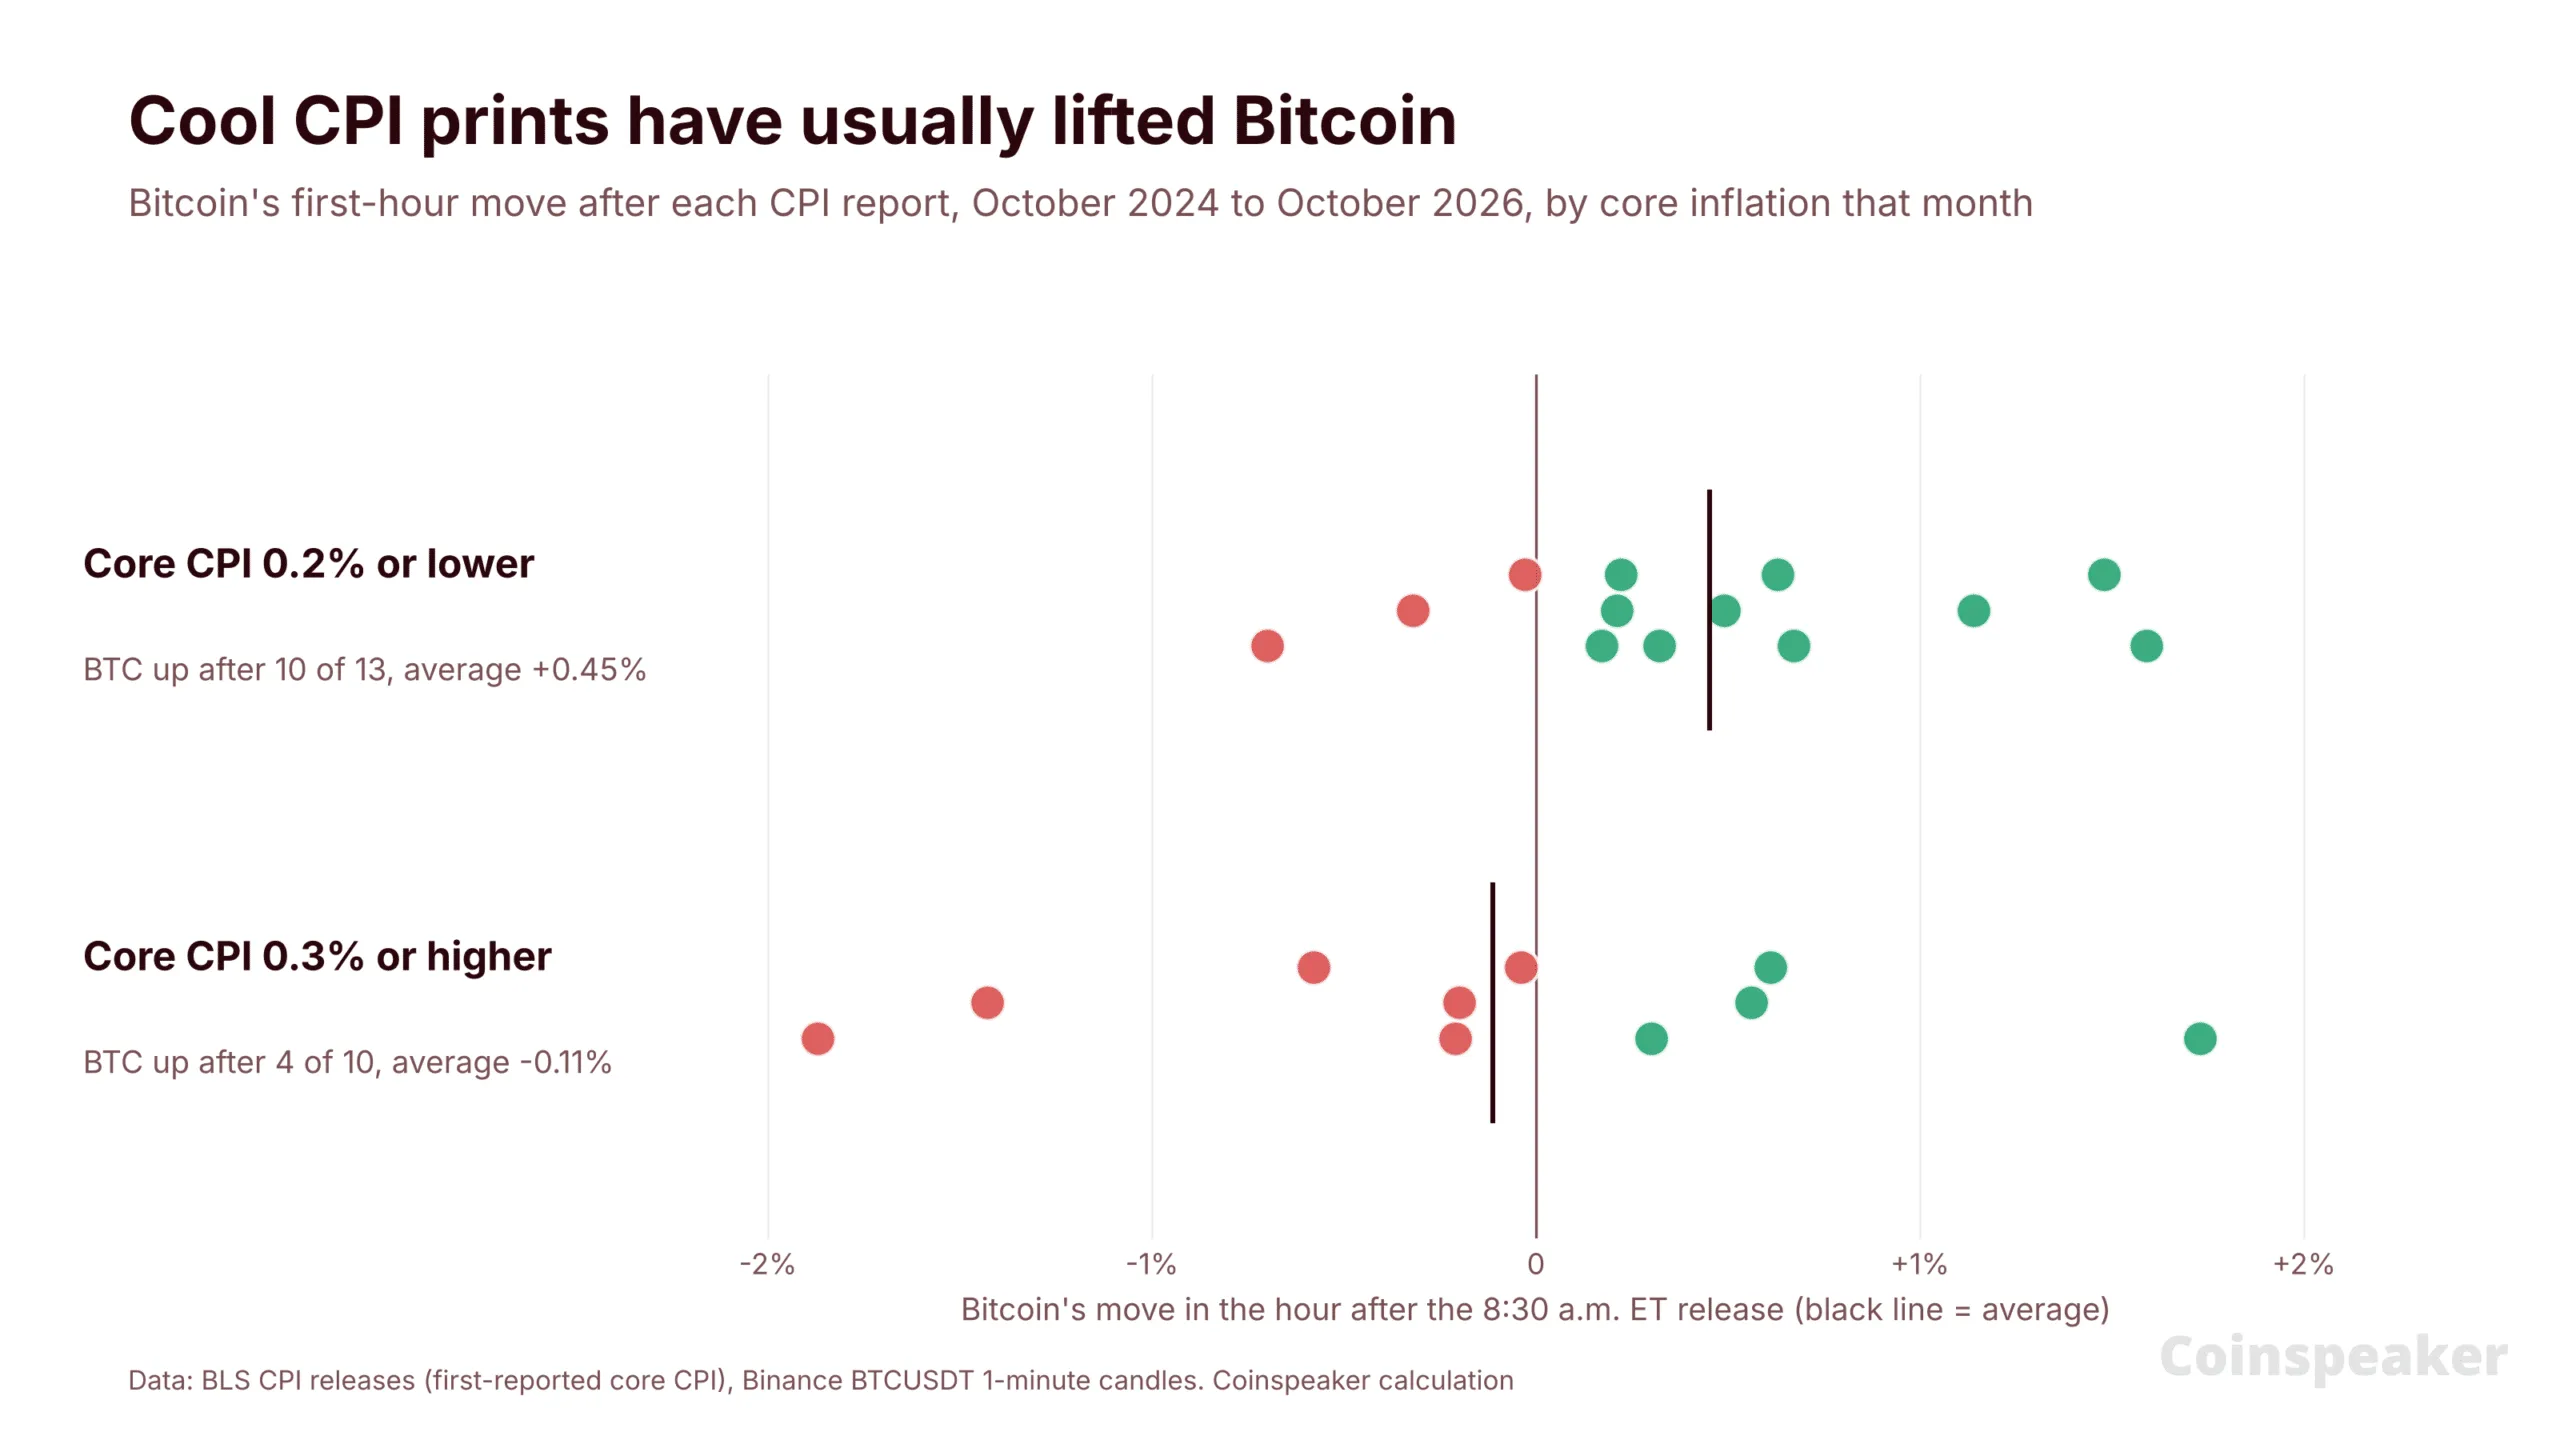
The pattern is a lean, not a rule. The biggest drop came on February 12, 2025, when core rose 0.4% and BTC lost 1.9% in an hour. Last months 0.3% reading cost it 1.4%.
Bitcoin Price Analysis: Can BTC Hold $73,510?
So far it has. BTC trades at $74,398 on Binance, about 1.2% above Sundays low.
On the daily chart, Bitcoin sits below both of its exponential moving averages (EMAs), averages that weight recent prices more. The 200-day EMA is at $76,481 and the 50-day EMA at $79,128.
- Resistance:$75,599, Mondays high, then $76,481, the 200-day EMA. Above that, $79,128, the 50-day EMA.
- Support:$74,177, Tuesdays low, then $73,510, Sundays low. Below that, $73,027, the August 21 low.
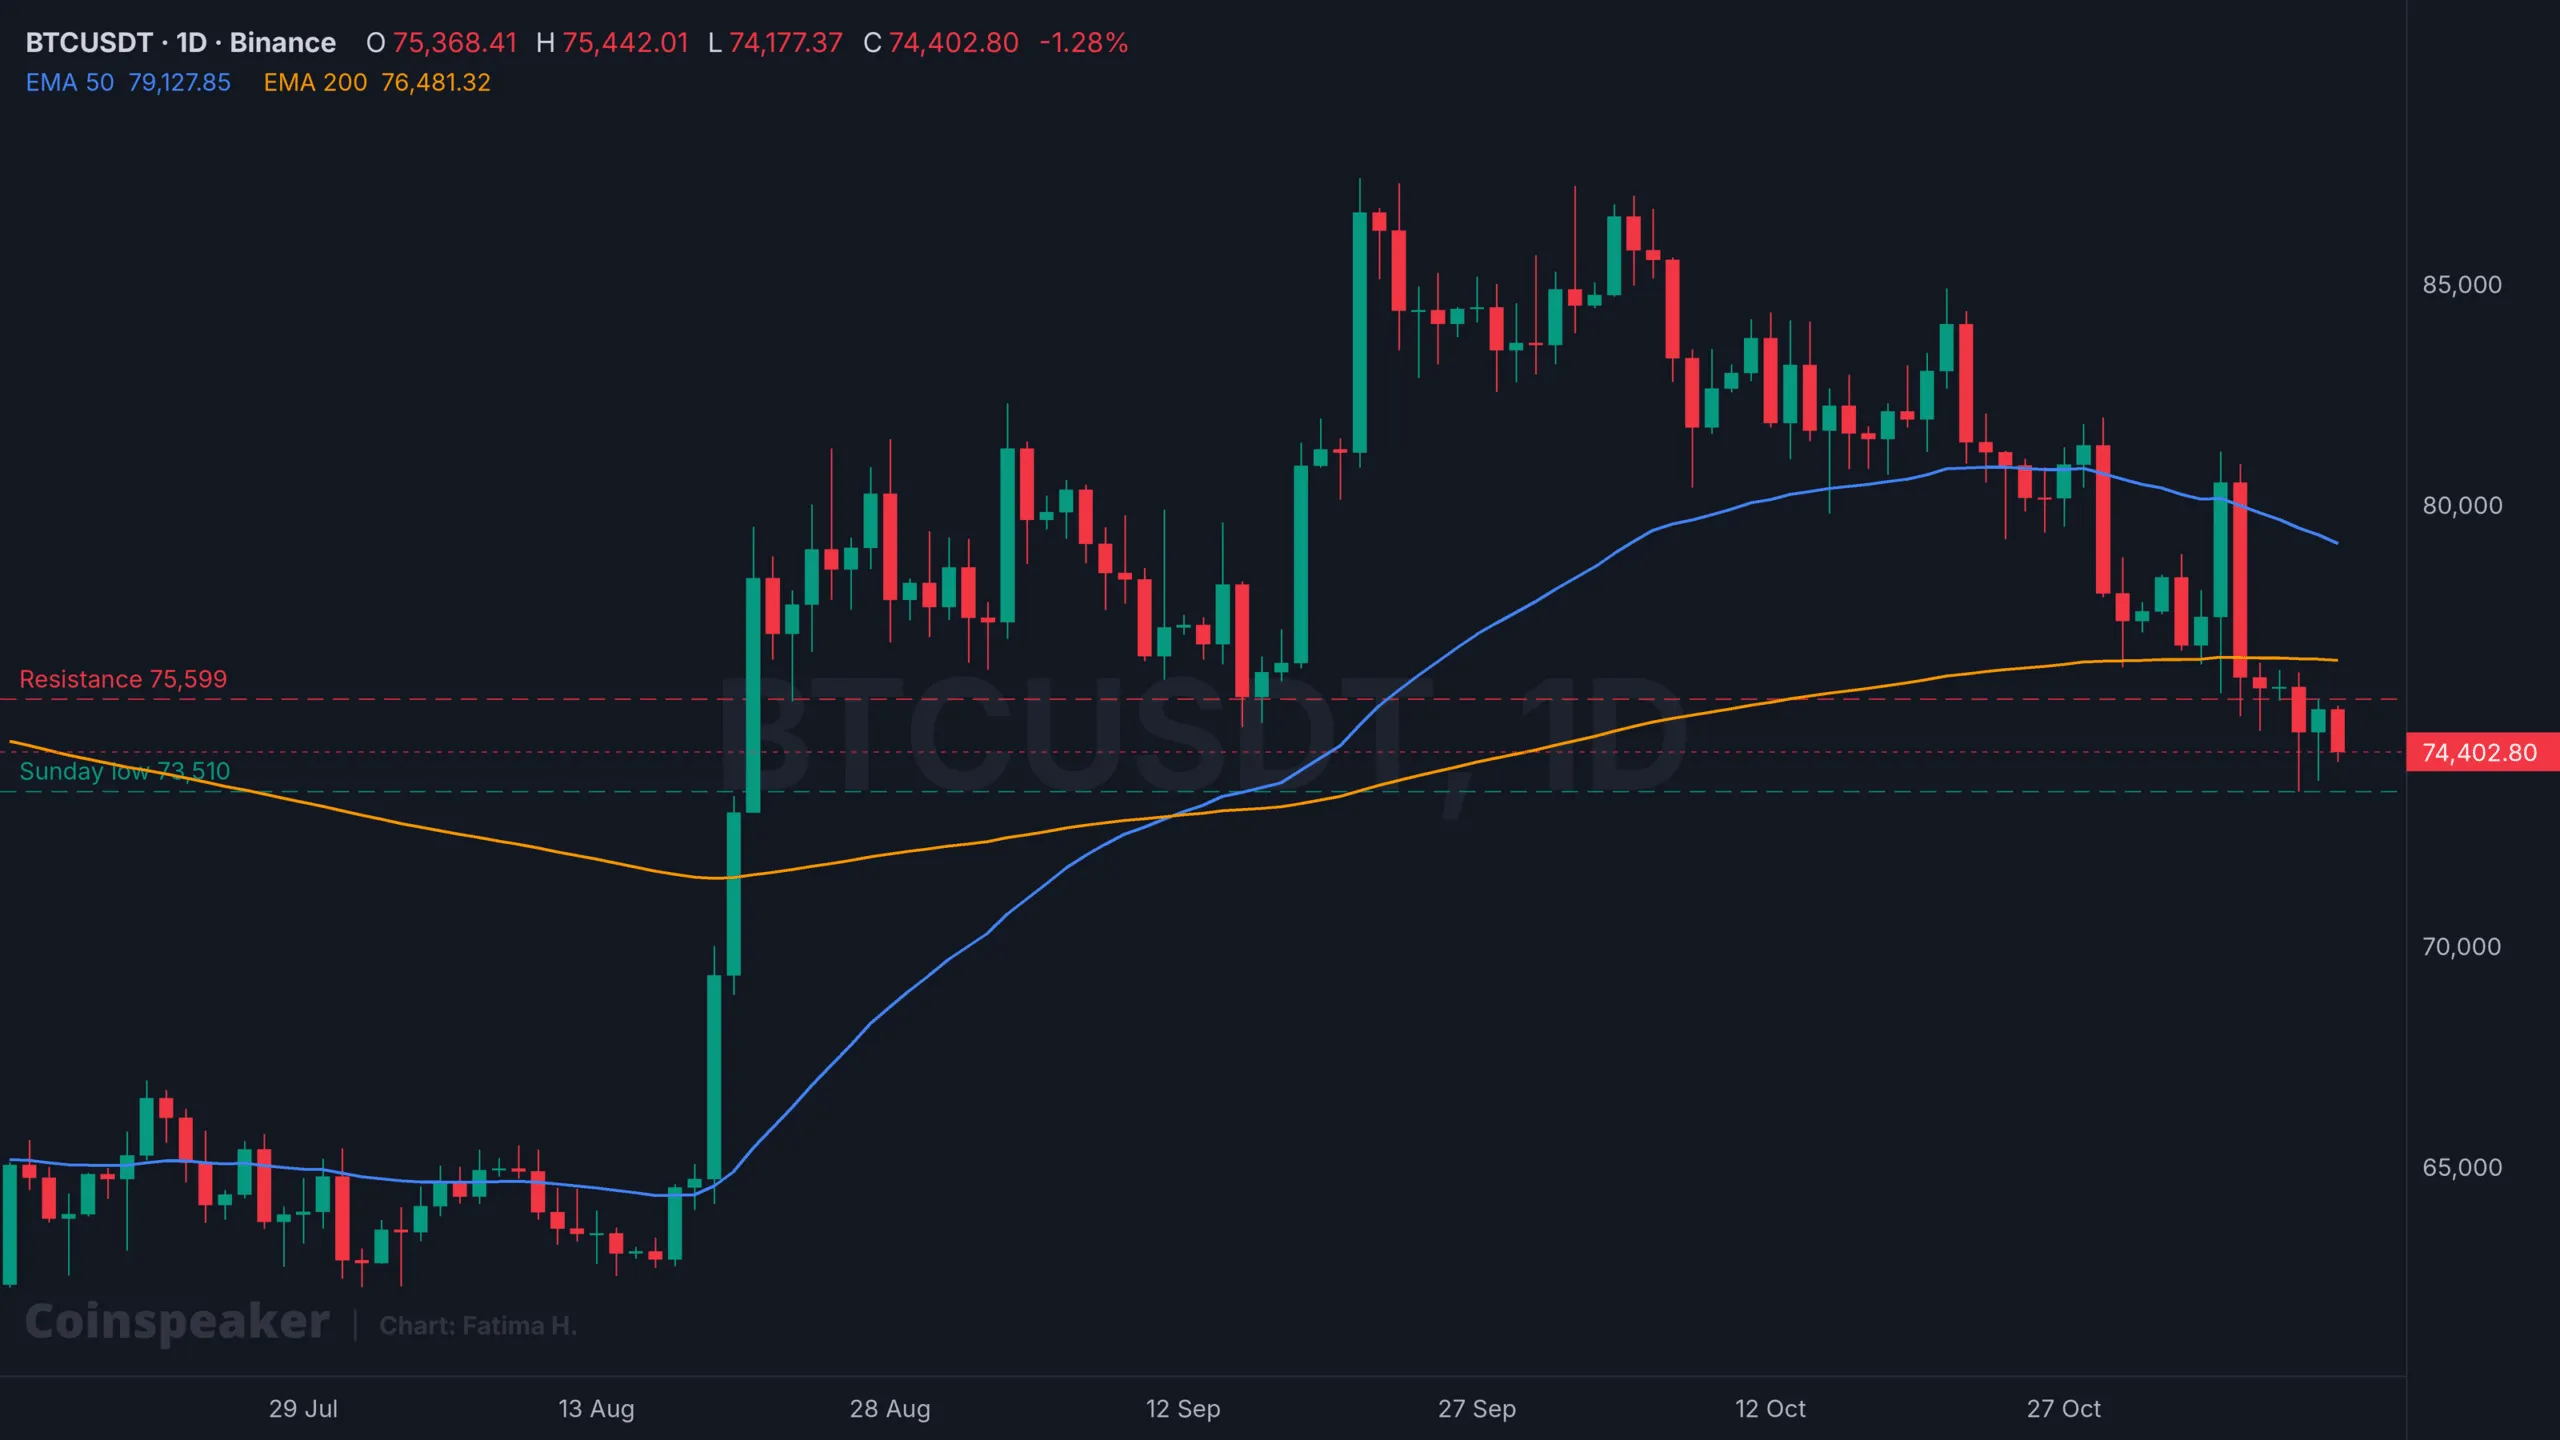
BTCUSDT 1D chart. Source: TradingView.
| CPI outcome | What it could mean | Level to watch |
|---|---|---|
| Core at 0.1% | Hike odds ease, room for a bounce | $75,599, then $76,481 |
| Core at 0.2% | In line, the market likely stays cautious | A range between $73,510 and $75,599 |
| Core at 0.3% or higher | December hike locked in | $73,510, then $73,027 |
For anyone tracking the Bitcoin CPI reaction, the first hour after 8:30 a.m. is the one to watch. In 20 of the last 24 reports, Bitcoin ended the next 24 hours moving in the same direction as in that first hour.
Market Intelligence: Crypto Analyst Predicts Best New Crypto to Hodl
Disclaimer: Coinspeaker is committed to providing unbiased and transparent reporting. This article aims to deliver accurate and timely information but should not be taken as financial or investment advice. Since market conditions can change rapidly, we encourage you to verify information on your own and consult with a professional before making any decisions based on this content.