




Hyperliquid (HYPE) has been one of the few large-cap tokens to hold up through the crypto downturn. HYPE price is still up sharply year to date, while Bitcoin trades roughly 15% lower.
That resilience is now being tested. HYPE trades near $72, about 26% below its September 23 all-time high of $97.99, and traders are asking whether the bull trend is over.
Sponsored

Sponsored
Bearish Structure Takes Shape
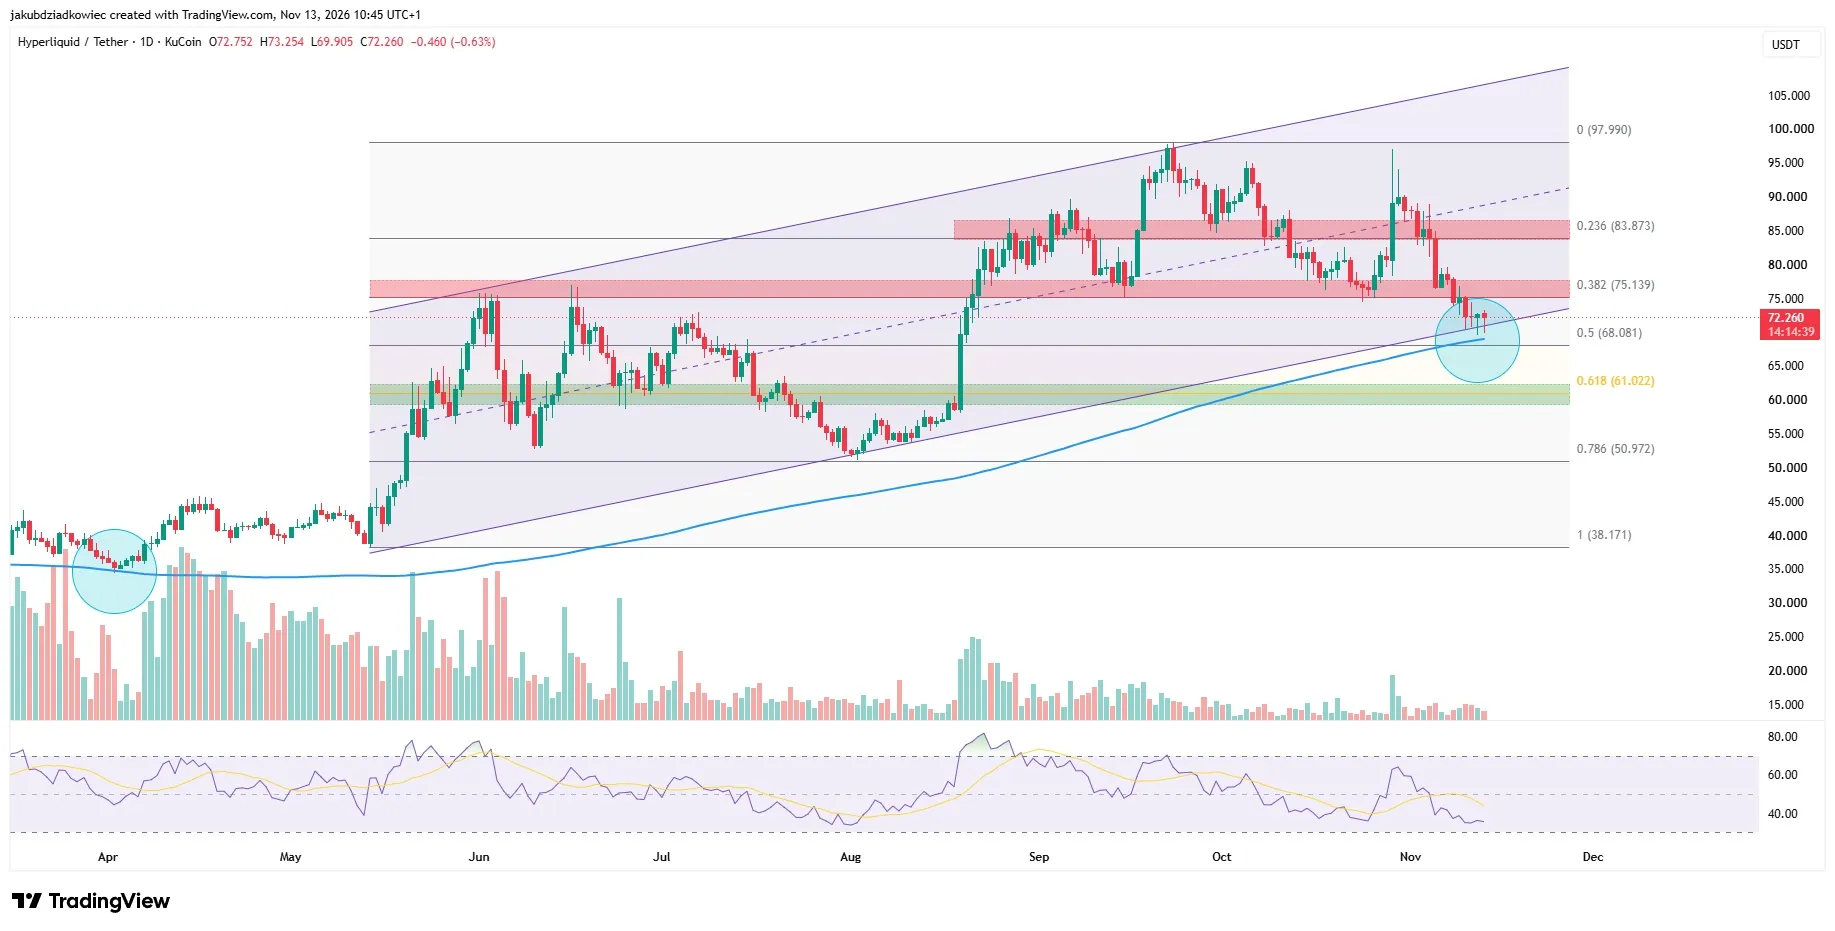
The daily chart has turned bearish. HYPE made a lower high on October 30, when a spike after Intercontinental Exchanges (ICE) futures announcement stalled just below the record. It has now made its first lower low since the August breakout.
The token also lost the 0.382 Fibonacci retracement near $75, which had held as support twice since September. Volume has been shrinking since peaks in April and June. The Relative Strength Index (RSI) has fallen to around 35, its lowest reading since August.
HYPE daily chart Source: Tradingview
Good news has not reversed the slide. HYPE kept falling after the ICE plan, the Upbit and Bithumb listings on November 10, and Binance reopening HYPE withdrawals on November 8.
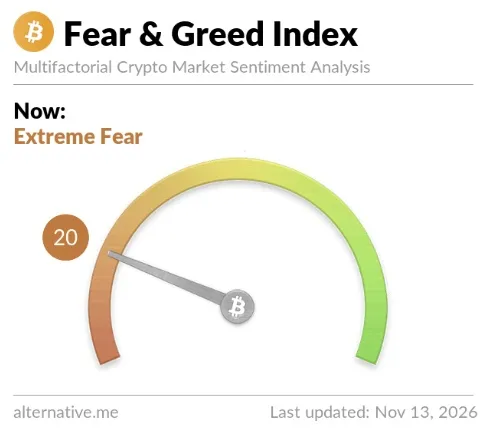
Two large holders sold about $109 million worth of HYPE on October 31. With the Crypto Fear & Greed Index at 20, risk appetite remains thin.
Sponsored
Sponsored
Crypto Fear & Greed Index Source: alternative.meFundamentals Tell a Different Story
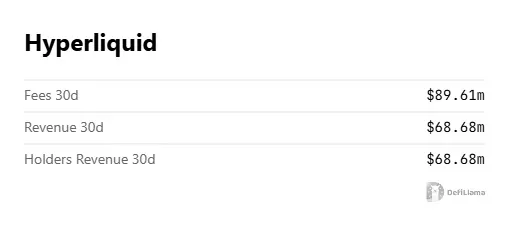
On-chain revenue paints a much stronger picture. According to DefiLlama, Hyperliquid generated $68.68 million in revenue over the past 30 days, all of it distributed to token holders through buybacks.
That works out to roughly $825 million a year. About 19% of gross revenue comes from USDC reserve yield, so that portion doesnt depend on trading activity.
Hyperliquid fees and revenue Source: DefiLlama
Analyst Jussy highlighted the same strength:
This is INSANE from $HYPE
Annualized revenue just hit nearly $1B based on the last 30 days
With only 11 people on the team, thats roughly 90M in revenue per employee
Plus, Coinbase AQA yield is adding another $15M/month on top
99% of all this revenue goes straight to… pic.twitter.com/mq1f7D5vNT
— jussy (@jussy_world) November 12, 2026
The buybacks, however, have only slowed the selling. They have not stopped the decline.
HYPE Price Levels to Watch
HYPE is now testing its most important support area, between $68 and $70. Three levels meet there: the 200-day moving average near $69, the lower band of the ascending channel near $70, and the 0.5 Fibonacci retracement at $68.08.
Buyers stepped in when todays candle dipped to $69.91. The last time HYPE tested the 200-day average, in April, it went on to rally from May.
A daily close below this zone would confirm the breakdown and open the way to the 0.618 Fibonacci level at $61. That level matches the area where HYPE consolidated in June and July. On the upside, bulls need to reclaim $75 to ease the pressure.
Whether high revenue can defend the 200-day average will likely decide if HYPEs trend survives.